GBP/USD is off the highs above 1.3300 but still holding onto high ground close to the number as optimism about a delay of Brexit prevails. What’s next?
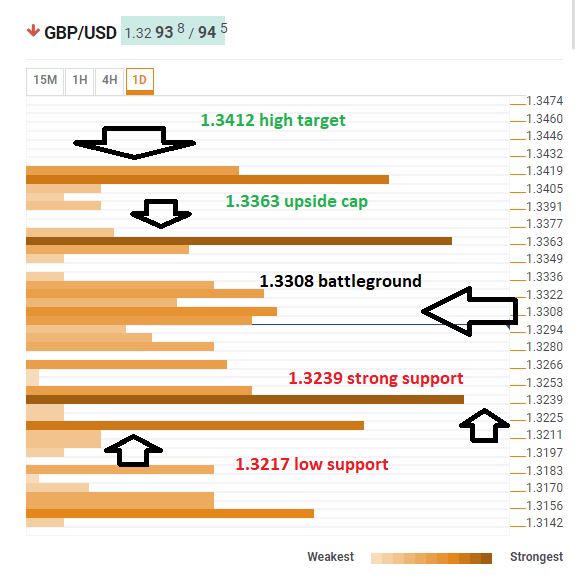
The Technical Confluences Indicator shows that cable battles a dense cluster of levels around 1.3308 where we see the Simple Moving Average 5-15m, the SMA 10-15m, the SMA 100-15m, the Bollinger Band 15min-Middle, the Fibonacci 38.2% one-day, and the SMA 50-15m.
Significant resistance awaits at 1.3363 where we see the meeting point of the Pivot Point one-day Resistance 1, the PP 1w-R3, and the previous daily high.
The next upside target is 1.3412 which is the confluence of the PP 1m-R1, the PP 1d-R2.
Looking down, significant support awaits at 1.3239 where we see the convergence of the previous day’s low, the PP 1w-R2, and the PP 1d-S1.
The next support line is very close, at 1.3217 where we see the previous month’s high, and the BB 4h-Middle.
This is how it looks on the tool:
Confluence Detector
The Confluence Detector finds exciting opportunities using Technical Confluences. The TC is a tool to locate and point out those price levels where there is a congestion of indicators, moving averages, Fibonacci levels, Pivot Points, etc. Knowing where these congestion points are located is very useful for the trader, and can be used as a basis for different strategies.
This tool assigns a certain amount of “weight” to each indicator, and this “weight” can influence adjacents price levels. This means that one price level without any indicator or moving average but under the influence of two “strongly weighted” levels accumulate more resistance than their neighbors. In these cases, the tool signals resistance in apparently empty areas.
