GBP/USD posted a winning week for a third straight time. It’s a light calendar this week, with two releases. Here is an outlook for the highlights and an updated technical analysis for GBP/USD.
In the UK, employment data improved. The number of unemployed persons fell by 15.1 thousand, compared to an expected rise of 25.6 thousand. Unemployment fell for a third straight month, dropping from 4.9% to 4.8%. Wage growth remained strong at 4.0%, but this was lower than the forecast of 4.5%.
Inflation was higher in April, as the reopening of the economy has led to increased economic activity. Headline inflation climbed to 1.5% in April, up sharply from 0.7% beforehand. Core CPI rose to 1.3%, up from 1.1%.
In the US, the Philly Fed Manufacturing Index slowed to 31.5, down sharply from 50.2 and shy of the forecast of 40.8. Unemployment claims fell for a third straight week, coming in at 444 thousand versus 478 thousand a week earlier. The Manufacturing PMI was up slightly to 61.5, above the forecast of 60.0. The Services PMI sparkled with a read of 70.1, as the business sector showed unprecedented growth. This beat the estimate of 64.3. The 50-level separates expansion from contraction.
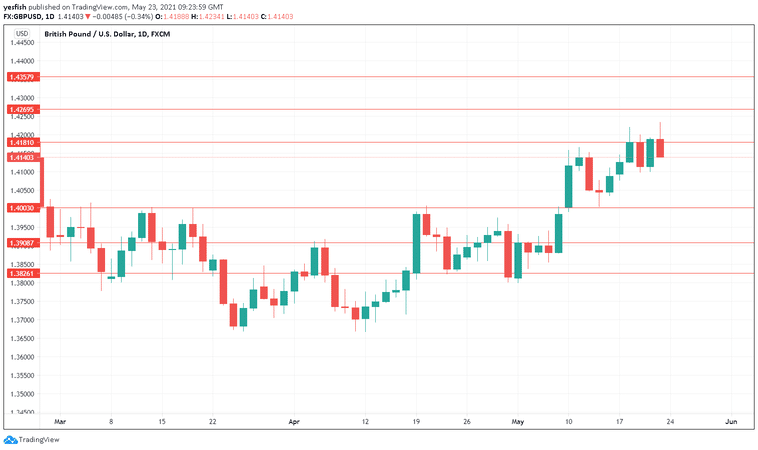
GBP/USD daily chart with support and resistance lines on it. Click to enlarge: