GBP/USD advanced on the weakness of the US Dollar and hopes for some kind of resolution on Brexit. What’s next? The technical levels point to additional upside potential.
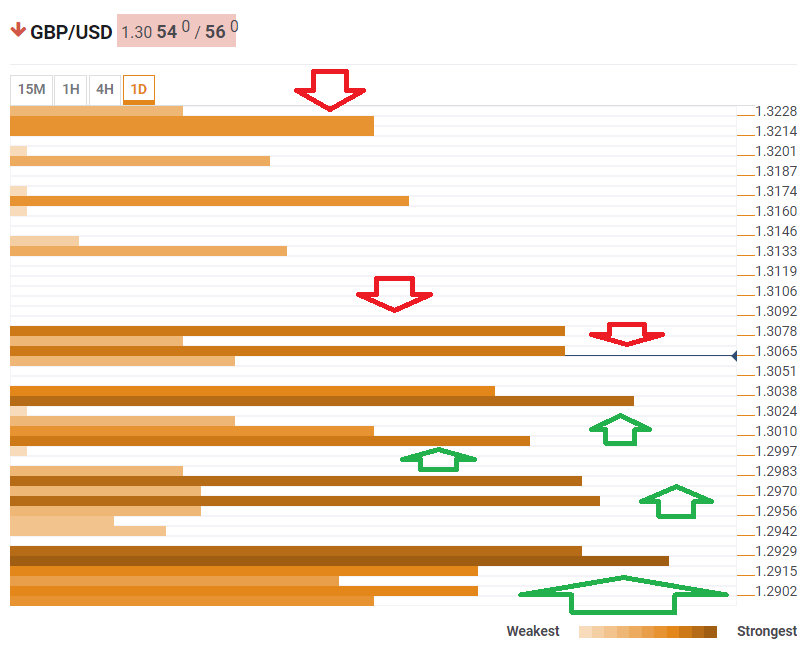
The Technical Confluences Indicator shows that cable now faces resistance around 1.3065 where we see a convergence including the Simple Moving Average 5-15m, the SMA 10-15m, the Pivot Point one-week Resistance 2, and the SMA 50-15m.
The next cap is very close. At 1.3078 we see the confluence of the Fibonacci 161.8% one-week, the Bollinger Band 4h-Upper, and the BB 15min-Upper.
From there onwards, the pair has lots of room to run higher, all the way to 1.3220 where the BB 1d-Upper and last month’s high.
On the downside, significant support awaits at 1.3038 which is a dense cluster including the BB 1h-Middle, the SMA 5-4h, the Fibonacci 23.6% one-month, and the Fibonacci 23.6% one-day.
The way down is packed with additional confluences. At 1.3010 we see the meeting point of the BB 1d-Middle, the SMA 100-15m, and the SMA 200-1d.
Around 1.2970 we see a minefield of substantial levels including the SMA 10-4h, the SMA 100-4h, the PP 1w-R1, the previous weekly high, the SMA 200-15m, and the SMA 50-1h.
The most significant support line is around 1.2929 where the all-important Fibonacci 38.2% one-month meets the BB 4h-Middle.
All in all, support is stronger than resistance.
This is how it looks on the tool:
Confluence Detector
The Confluence Detector finds exciting opportunities using Technical Confluences. The TC is a tool to locate and point out those price levels where there is a congestion of indicators, moving averages, Fibonacci levels, Pivot Points, etc. Knowing where these congestion points are located is very useful for the trader, and can be used as a basis for different strategies.
This tool assigns a certain amount of “weight” to each indicator, and this “weight” can influence adjacents price levels. This means that one price level without any indicator or moving average but under the influence of two “strongly weighted” levels accumulate more resistance than their neighbors. In these cases, the tool signals resistance in apparently empty areas.
