GBP/USD kicks off another critical week in Brexit news stable in range, but things are unlikely to stay this way amid a third Meaningful Vote and the EU Summit. Where next? The technical charts favor the upside.
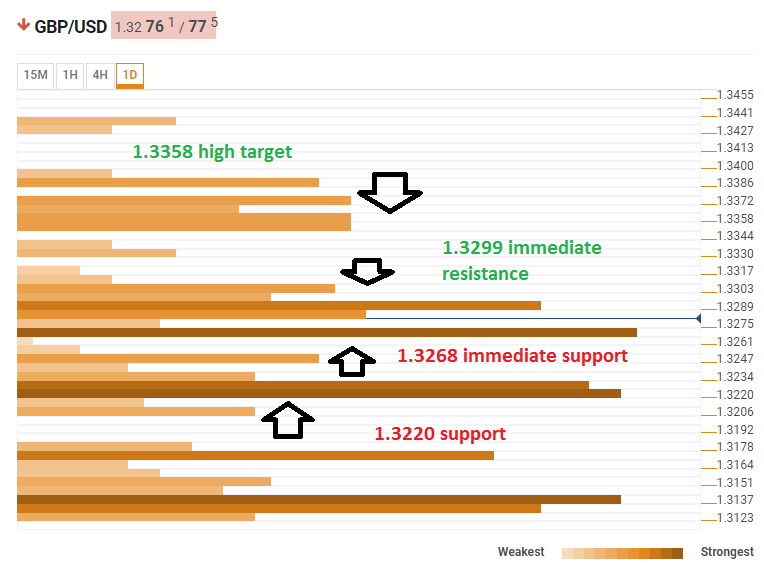
The Technical Confluences Indicator shows that cable enjoys significant support at around 1.3268 where we see the convergence of the Simple Moving Average 200-15m, the Fibonacci 38.2% one-day, the SMA 10-4h, and the Bollinger Band 1h-Lower.
Another substantial cushion awaits at 1.3220 which is the confluence of the Fibonacci 23.6% one-month, the SMA 100-1h, the SMA 5-1d, the Fibonacci 38.2% one-week, and more.
Looking up, resistance is near, but it is weaker than the support confluence. At 1.3299 we see the following lines convergence: the BB 15min-Lower, the BB 1h-Middle, the Fibonacci 23.6% one-week, the previous 4h-Low, the SMA 5-15m.
The next resistance lines are somewhat spread out and do not consist of a dense cluster that could halt the advance of GBP/USD. However, 1.3358 is notable as the meeting point of the BB 4h-Upper, the previous month’s high, and the Pivot Point one-day Resistance 2.
This is how it looks on the tool:
Confluence Detector
The Confluence Detector finds exciting opportunities using Technical Confluences. The TC is a tool to locate and point out those price levels where there is a congestion of indicators, moving averages, Fibonacci levels, Pivot Points, etc. Knowing where these congestion points are located is very useful for the trader, and can be used as a basis for different strategies.
This tool assigns a certain amount of “weight” to each indicator, and this “weight” can influence adjacents price levels. This means that one price level without any indicator or moving average but under the influence of two “strongly weighted” levels accumulate more resistance than their neighbors. In these cases, the tool signals resistance in apparently empty areas.
