GBP/USD has kicked off the week on the back foot after the UK parliament forced the UK government to ask for a Brexit extension. The battle in parliament continues today. How is cable positioned?
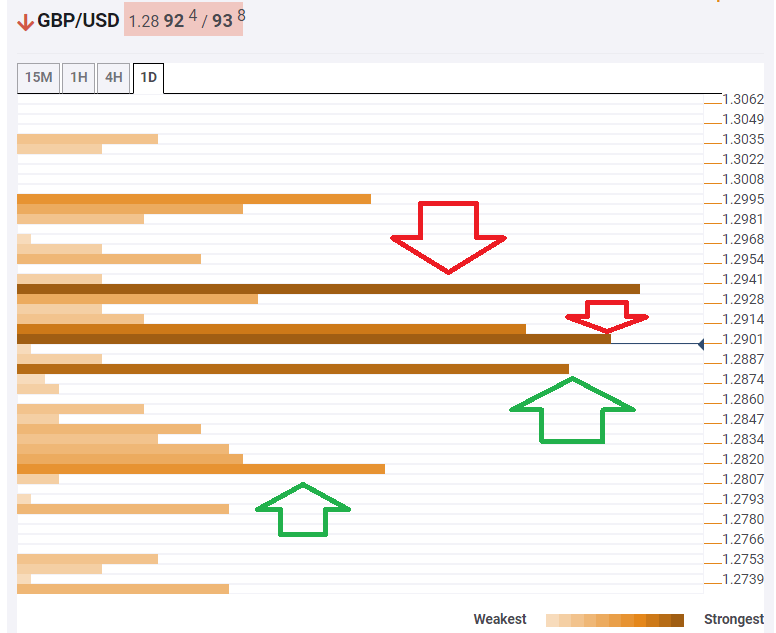
The Technical Confluences Indicator is showing that GBP/USD now faces an uphill battle. It faces robust resistance at 1.2902, which is the convergence of the Fibonacci 61.8% one-day, the Simple Moving Average 10-4h, the Bollinger Band 15-minutes Lower, and the previous 4h-low.
An even more considerable hurdle awaits at 1.2935, which is the meeting point of the BB one-day Upper, and the Fibonacci 38.2% one-day.
Looking down, GBP/USD has significant support at 1.2880, which is the confluence of the SMA 50-1h, the Fibonacci 23.6% one-week, and the Pivot Point one-day Support 1.
If it loses that line, only weak support awaits at 1.2815, which is where the Fibonacci 38.2% one-week and the SMA 100-1h converge.
All in all, the path of least resistance is down.
This is how it looks on the tool:
Confluence Detector
The Confluence Detector finds exciting opportunities using Technical Confluences. The TC is a tool to locate and point out those price levels where there is a congestion of indicators, moving averages, Fibonacci levels, Pivot Points, etc. Knowing where these congestion points are located is very useful for the trader, and can be used as a basis for different strategies.
This tool assigns a certain amount of “weight” to each indicator, and this “weight” can influence adjacents price levels. This means that one price level without any indicator or moving average but under the influence of two “strongly weighted” levels accumulate more resistance than their neighbors. In these cases, the tool signals resistance in apparently empty areas.
Learn more about Technical Confluence
