- The bullish breakout from the triangle pattern is failing.
- The level to beat for sellers is the 1.2973 level.
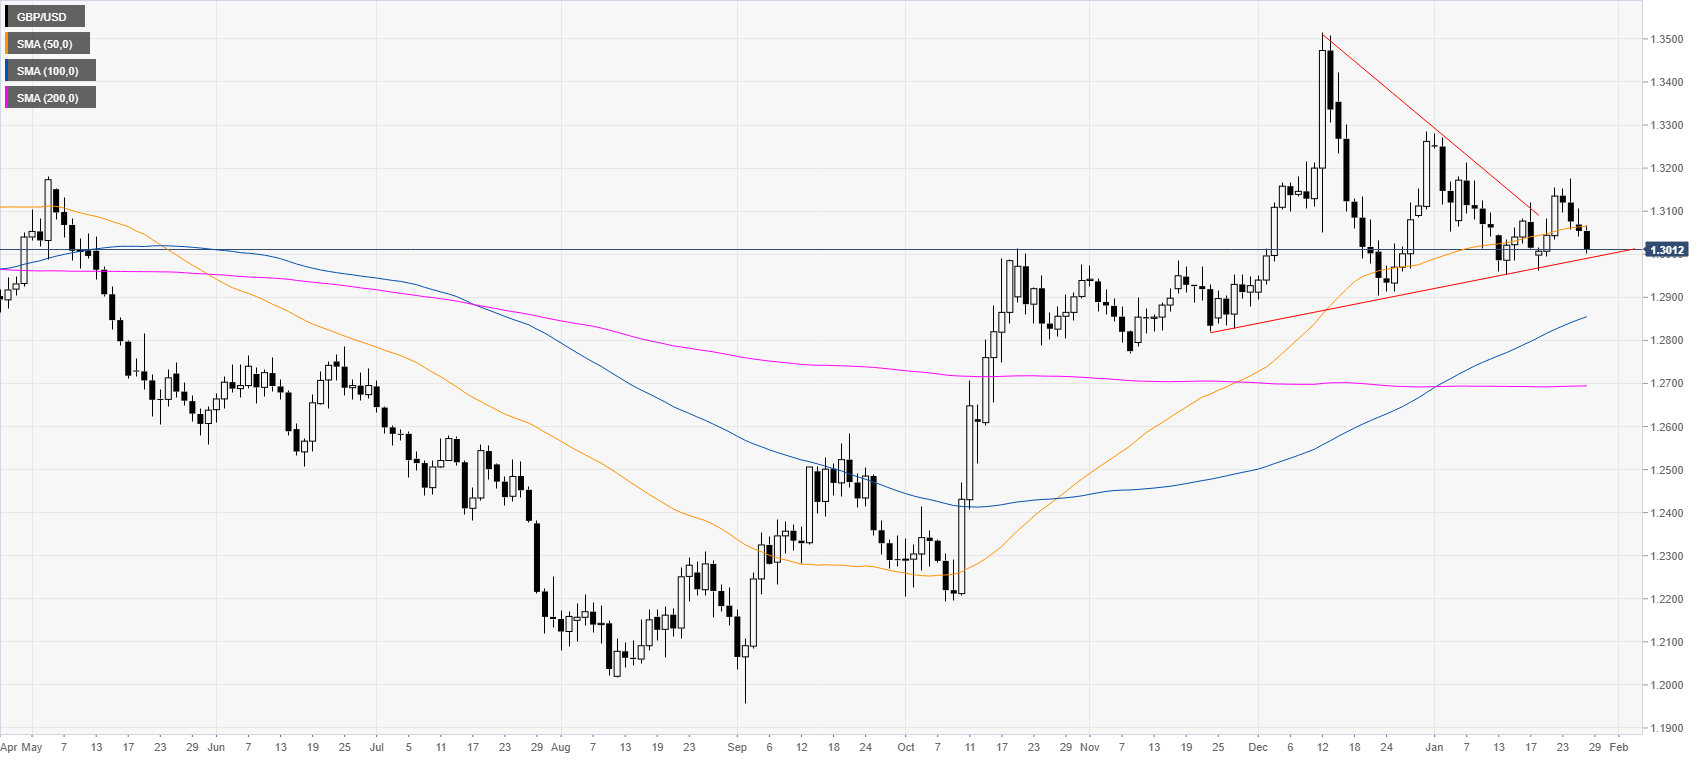
GBP/USD daily chart
The breakout from the triangle formation looks like it is failing below the 1.3100 figure. The spot broke below the 50-day simple moving average (SMA) and is nearing and ascending trendline.
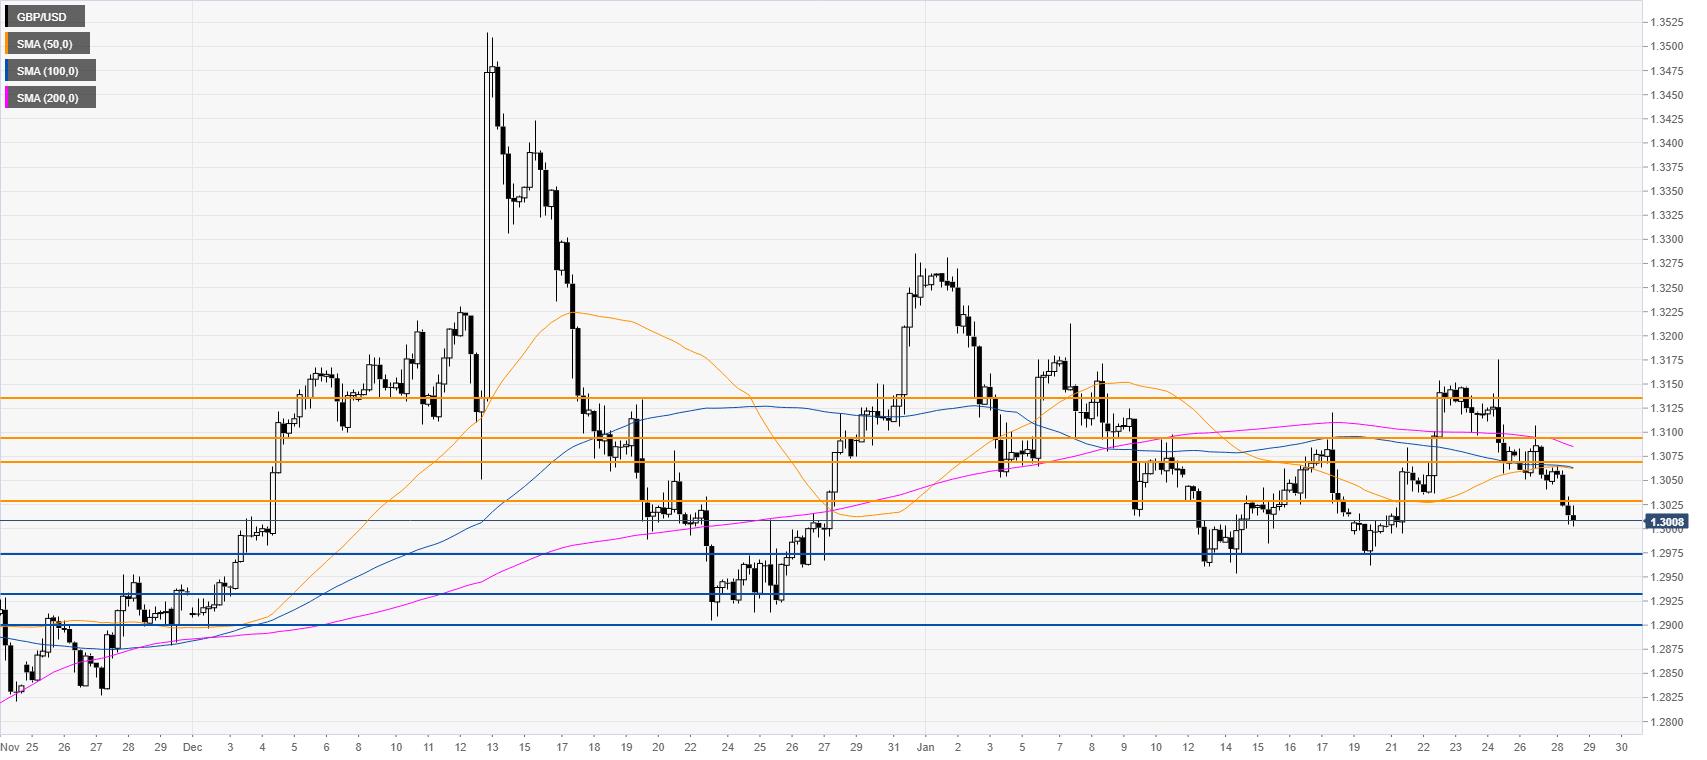
GBP/USD four-hour chart
The pound is challenging the session’s lows while below the main SMAs on the four-hour chart. In the last four sessions, the bears have taken the lead. The odds are tilted to the downside and GBP/USD could reach 1.2973, 1.2932 and 1.2900 figure. Resistances are seen near 1.3030, 1.3067, 1.3094 and 1.3135 levels, according to the Technical Confluences Indicator.
Additional key levels
