- GBP/USD is trading in 35-year’s lows near the 1.1600 figure.
- The level to beat for bears is the 1.1546 support.
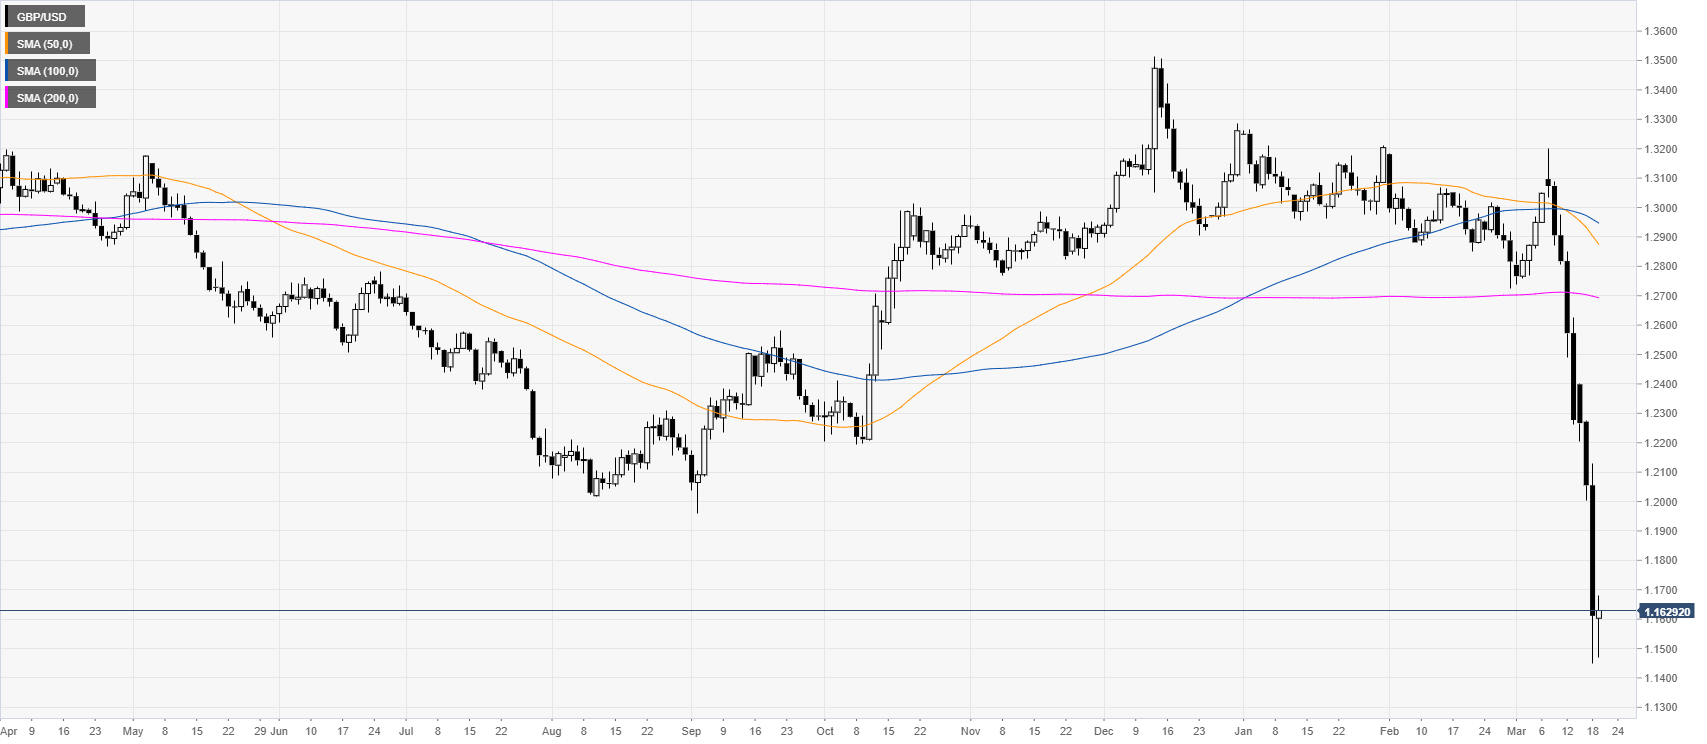
GBP/USD daily chart
GBP/USD has been melting down in the last two weeks as the market is trading off its lowest point since 1985. USD strength, combined with GBP weakness is weighing heavily on GBP/USD.
GBP/USD four-hour chart
GBP/USD is correcting up slightly while trading in 35-year’s lows. The market remains vulnerable to the downside with bears looking to break the 1.1546 support level en route towards the 1.1485 and 1.1400 figure in the short term. Bullish attempts could be short-lived with potential resistance near 1.1650, 1.1720 and 1.1800 figure, according to the Technical Confluences Indicator.
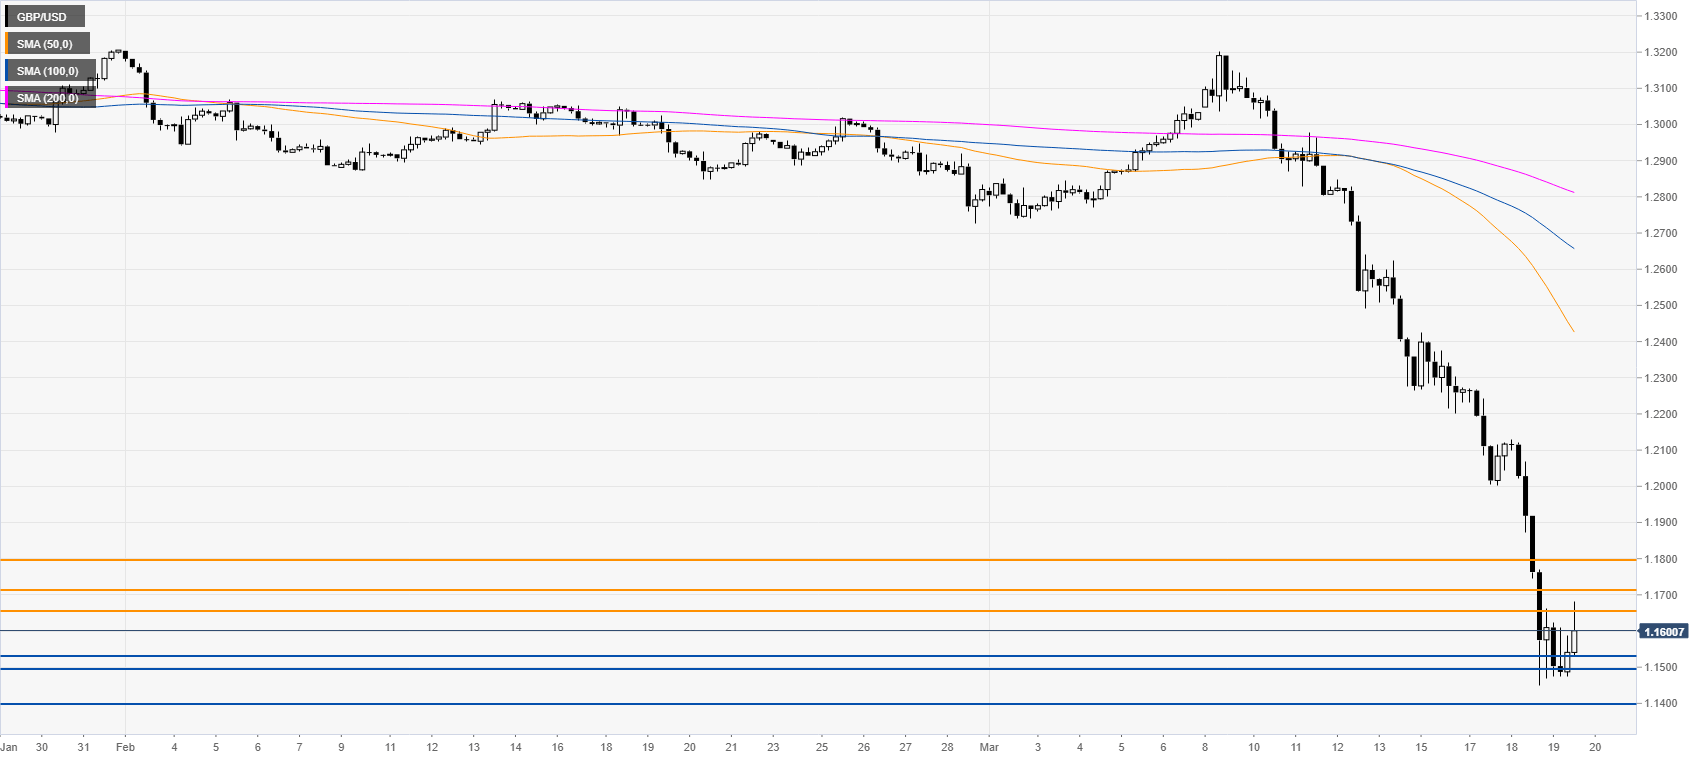
Resistance: 1.1650, 1.1720, 1.1800
Support: 1.1546, 1.1485, 1.1400
Additional key levels
