- GBP/USD struggles to extend the south-run below multi-week bottom, 61.8% Fibonacci retracement.
- A confluence of 200-day EMA and 50% Fibonacci retracement limits the pair’s pullback moves.
- A downside break will highlight September 2019 top for the bears.
GBP/USD remains mostly stable around 1.2818, after declining to the lowest since October 16, 2019, on Friday, during the Asian session on Monday.
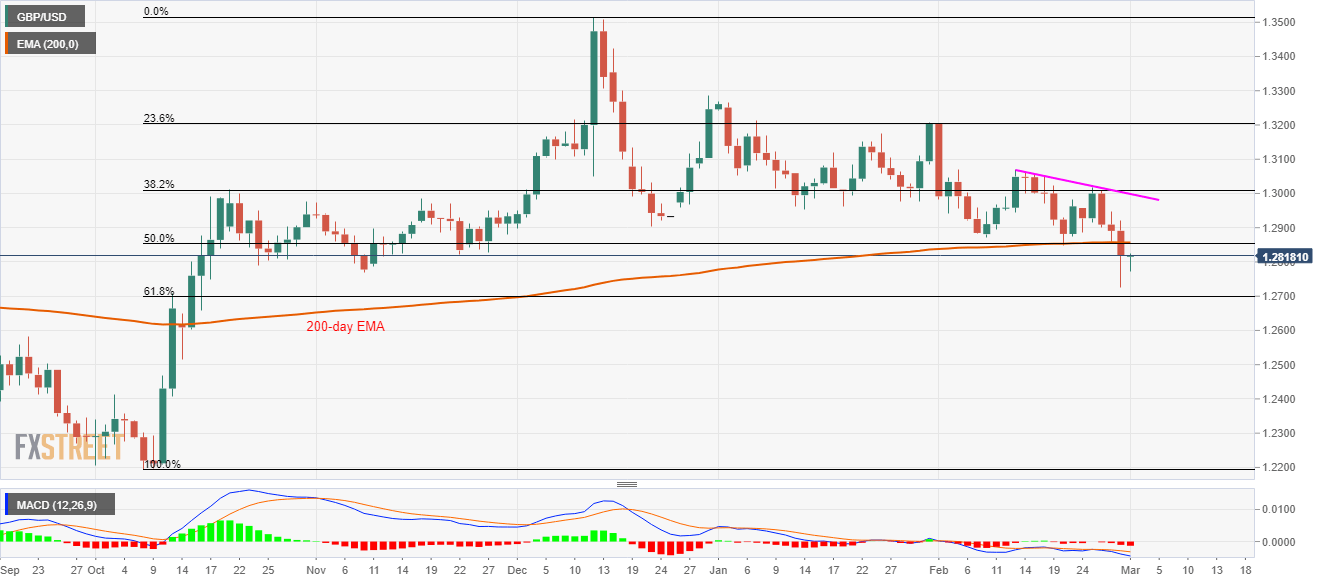
Even so, the pair remains below the key short-term resistance comprising 200-day EMA and 50% Fibonacci retracement of October-December 2019 upside, around 1.2855/60.
If at all prices manage to cross 1.2860 on a daily closing basis, a descending trend line from February 13 near 1.3000 will be on the bulls’ radars.
Meanwhile, 61.8% Fibonacci retracement level of 1.2700 acts as the immediate support ahead of September 2019 high close to 1.2580.
Should there be a further decline past-1.2580, 1.2415 and October 2019 low near 1.2200 will lure the bears.
GBP/USD daily chart
Trend: Bearish
