- GBP/USD struggles to extend recovery gains.
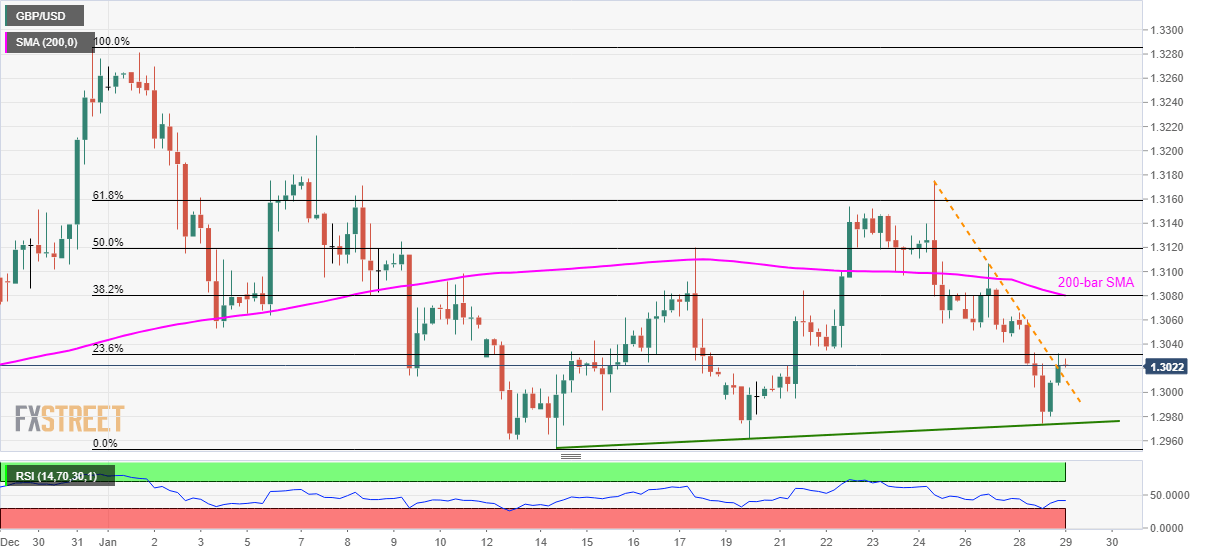
- 200-bar SMA, 38.2% Fibonacci retracement caps the near-term upside.
- A two-week-old rising trend line offers immediate support.
GBP/USD trades near 1.3025 during the early Wednesday’s trading session. The pair recently broke a three-day-old falling trend line but is still to cross the near-term key resistance confluence.
Ahead of the 1.3080 upside barrier, 23.6% Fibonacci retracement level of its December 31 to January 14 fall, at 1.3035, followed by 1.3050, will question the buyers.
In a case where the quote rallies beyond 1.3080, 50% and 61.8% Fibonacci retracements near 1.3120 and 1.3160 respectively will challenge the bulls.
Meanwhile, an ascending trend line since January 14, at 1.2970 now, can restrict the pair’s short-term declines ahead of the monthly bottom surrounding 1.2950.
GBP/USD four-hour chart
Trend: Bearish
