- GBP/USD briefly recaptures 1.3900 but the further upside appears limited.
- Powerful resistance awaits at 1.3920 while RSI stays bullish.
- The cable rebounds as the US dollar drops along with Treasury yields.
GBP/USD fails to find acceptance above the 1.3900 and recedes, although holds a major portion of intraday gains so far this Tuesday.
Broad-based US dollar weakness, amid an extension of the retreat in the Treasury yields, continues to aid the recovery in the cable from the 1.3800 level.
From a short-term technical perspective, as observed on the four-hour chart, the GBP bulls look to challenge the powerful barrier at 1.3820, which is the convergence of the falling trendline resistance and the bearish 50-simple moving average (SMA).
A four-hour candlestick closing above the latter would confirm a falling wedge breakout for the major, with the next major hurdle seen at the horizontal 100-SMA at 1.3959.
The relative strength index (RSI) has reclaimed the bullish territory, now trading at 51.90, allowing room for more upside.
It’s worth noting that the price has pierced through the critical 200 and 21-SMAs earlier on, boosting the odds for an extended recovery.
GBP/USD: Four-hour chart
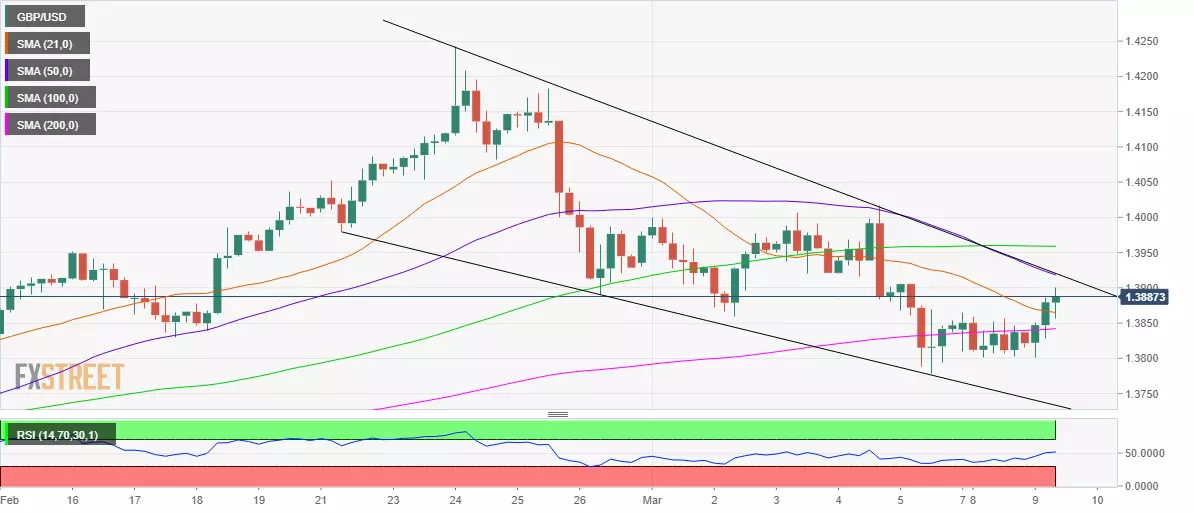
On the flip side, the 21-SMA resistance now support at 1.3865 could be tested on any pullback.
The downside could be then protected by the horizontal 200-SMA at 1.3842.
All in all, the path of least resistance appears to the upside on a sustained break above the 1.3920 barrier.
GBP/USD: Additional levels
