- GBP/USD drops below the six-day-old support line.
- An ascending trend line from April 21 is on the bear’s radars.
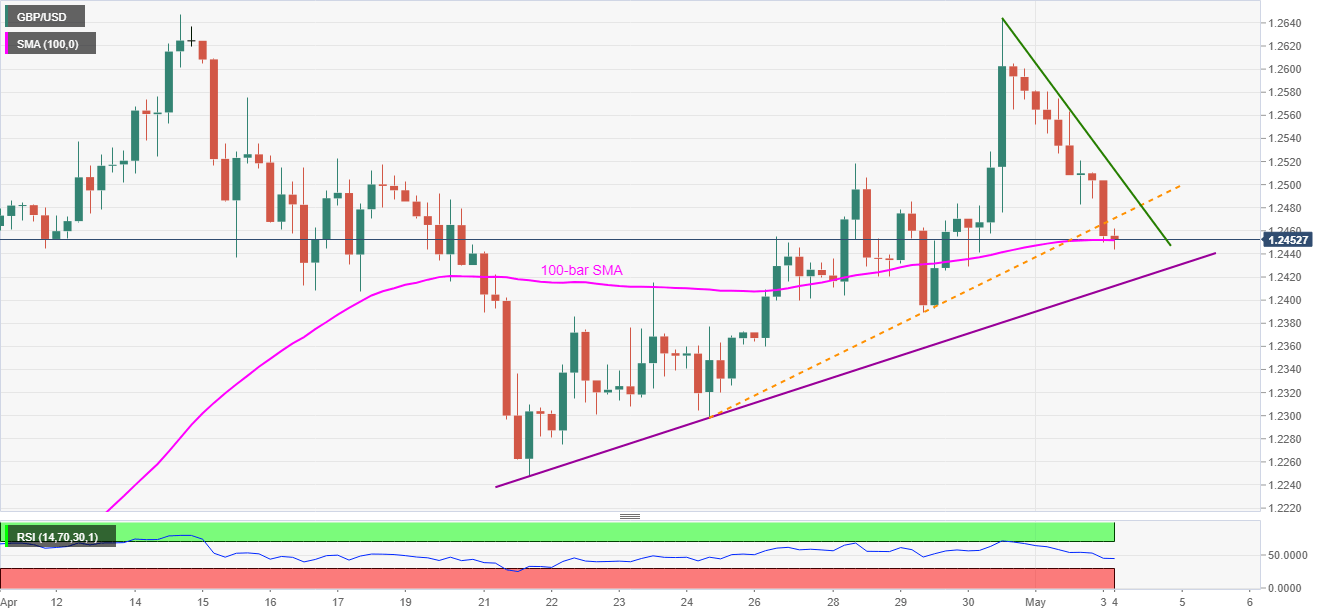
- A short-term falling resistance line will question the recovery moves.
Having breached a six-day-old support line, now resistance, GBP/USD takes rounds to 1.2455, down 0.40 on a day, during the Asian session on Monday.
The Cable currently takes rests on the 100-bar SMA level near 1.2450, a break of which could drag it further down to a bit broader support line, around 1.2410.
If at all sellers fail to respect 1.2410 support trend line, 1.2380 might check the bears ahead of pleasing them with the late-April low surrounding 1.2250/45.
Alternatively, a falling trend line from Thursday’s top, at 1.2515 now, can guard the pair’s recovery moves ahead of 1.2600 resistance mark.
Should there be a clear run-up past-1.2600, the April month top close to 1.2645 could lure the buyers.
GBP/USD daily chart
Trend: Pullback expected
