- GBP/USD trades in a choppy range around 1.3350-60.
- Strong RSI conditions, not overbought, suggest further advances of the pair.
- 21-day SMA adds to the downside filter, September high on bulls’ radars.
GBP/USD wavers around 1.3350, recently picking up bids near 1.3355, during early Friday. In doing so, the pair stops the previous day’s U-turn from the highest since September 02 while testing an upward sloping trend line from November 02.
With the RSI conditions a bit lower than the overbought, the latest recovery in the GBP/USD price can continue justifying the bounce from a strong support line towards the monthly high near 1.3400.
It should, however, be noted that the pair’s ability to cross the 1.3400 threshold will eye the fresh the yearly top, beyond September’s peak of 1.3482.
Meanwhile, a daily closing below the stated support line, at 1.3345 now, will take the quote towards a 21-day SMA level of 1.3198.
Though, GBP/USD traders need to break October’s top of 1.3176 to keep the reins past-1.3198.
GBP/USD daily chart
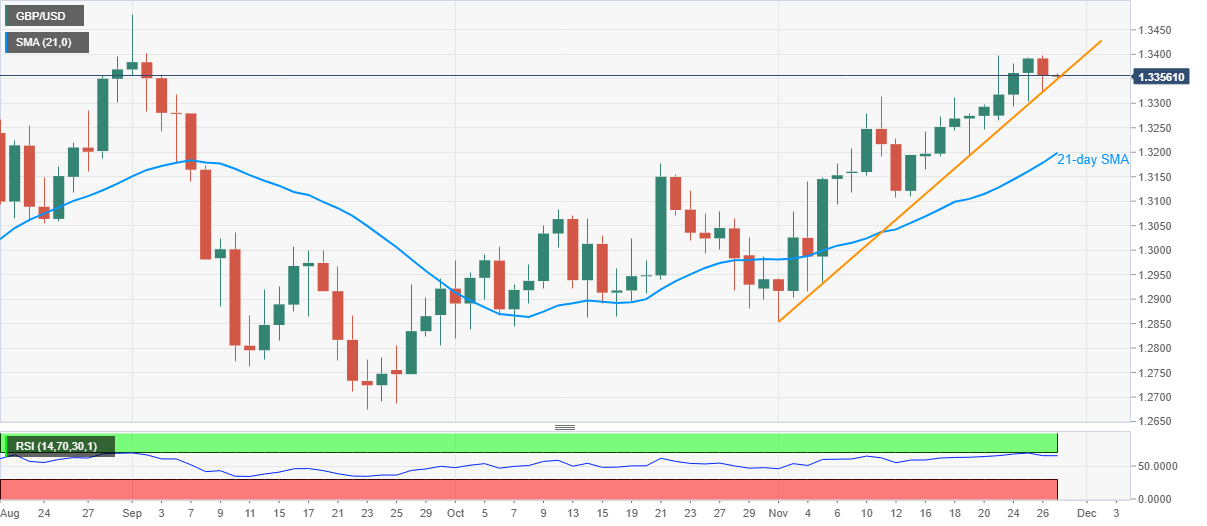
Trend: Bullish
