- GBP/USD register modest changes after pulling back from the monthly top the previous day.
- 50-HMA, two-day-old resistance line guard immediate upside.
- 61.8% Fibonacci retracement adds to the support.
Despite staying modestly changed to 1.2520 amid the initial Asian session on Thursday, GBP/USD remains on the bears’ watch-list as being under the short-term key resistance confluence.
Not only the pair’s sustained trading below 50-HMA and short-term falling trend line but normal RSI conditions amid weak price performance below 23.6% Fibonacci retracement of the early month’s upside also favor the sellers.
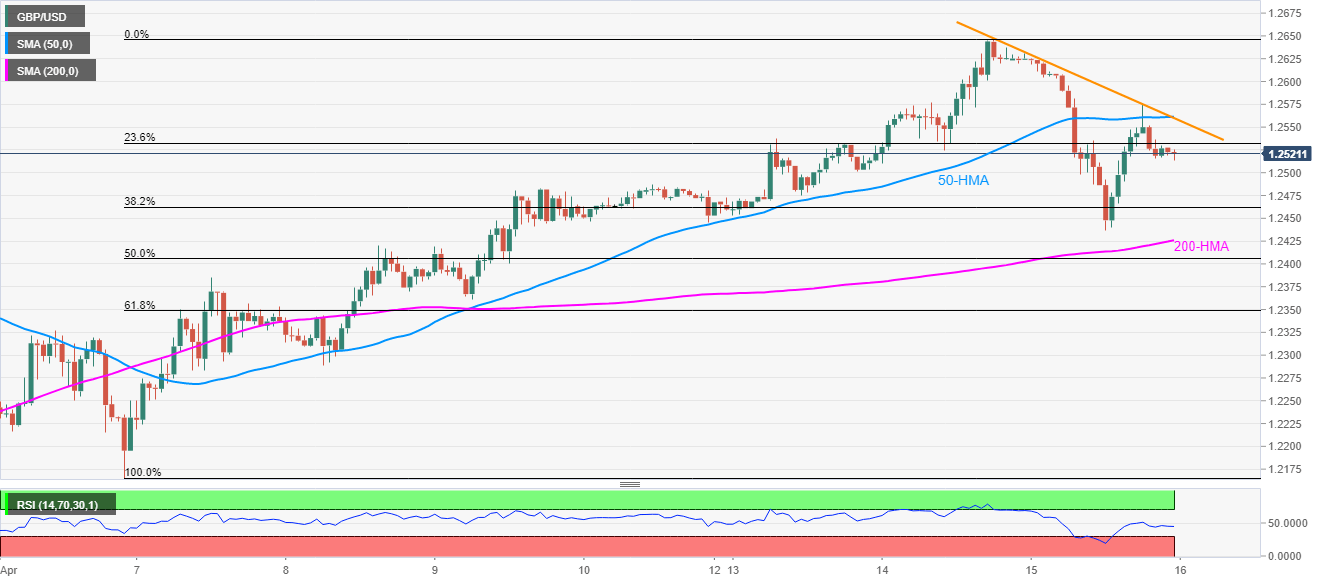
Hence, a gradual fall towards a 200-HMA level of 1.2425 can’t be ruled out. However, 38.2% Fibonacci retracement and Wednesday’s low can offer intermediate halts around 1.2460 and 1.2435 respectively.
Meanwhile, an upside clearance beyond 1.2560/65 resistance confluence can recall buyers targeting to refresh the monthly top above 1.2650.
GBP/USD hourly chart
Trend: Further declines expected
