- GBP/USD stays positive near the highest levels in three weeks.
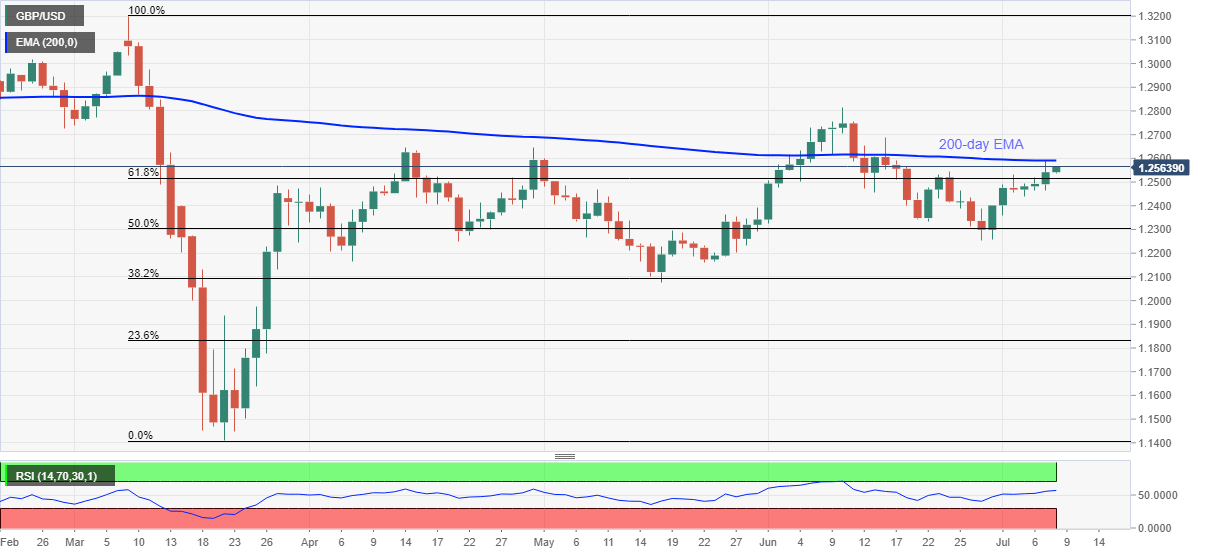
- A clear break above 61.8% Fibonacci retracement favors further upside.
- Optimists can eye June month high above the key EMA, Friday’s bottom could regain market attention under 1.2515.
GBP/USD takes the bids near 1.2565 amid the initial hours of Tokyo trading on Wednesday. The pair crossed 61.8% Fibonacci retracement of March month moves the previous day. However, 200-day EMA stopped bulls around a multi-day top.
Considering the Cable’s ability to stay beyond the key Fibonacci retracement, buyers are again attacking the 200-day EMA level of 1.2590. Though, the pair’s additional rise needs to gain validation by crossing the 1.2600 threshold.
In doing so, the buyers may aim for June 16 high of 1.2688 as an intermediate stop before targeting June monthly peak surrounding 1.2815.
Meanwhile, sellers may take entries on the downside break below 61.8% Fibonacci retracement level of 1.2515, which in turn could highlight Friday’s low of 1.2438.
Should the bears refresh the monthly low under 1.2438, 1.2400 and the June month bottom close to 1.2250 will flash on their radars.
GBP/USD daily chart
Trend: Bullish
