- GBP/USD attempts recovery from a four-day low of 1.2550.
- Oversold RSI conditions, key HMA increase odds of the pullback.
- Sellers may aim for July 08 low during further downside.
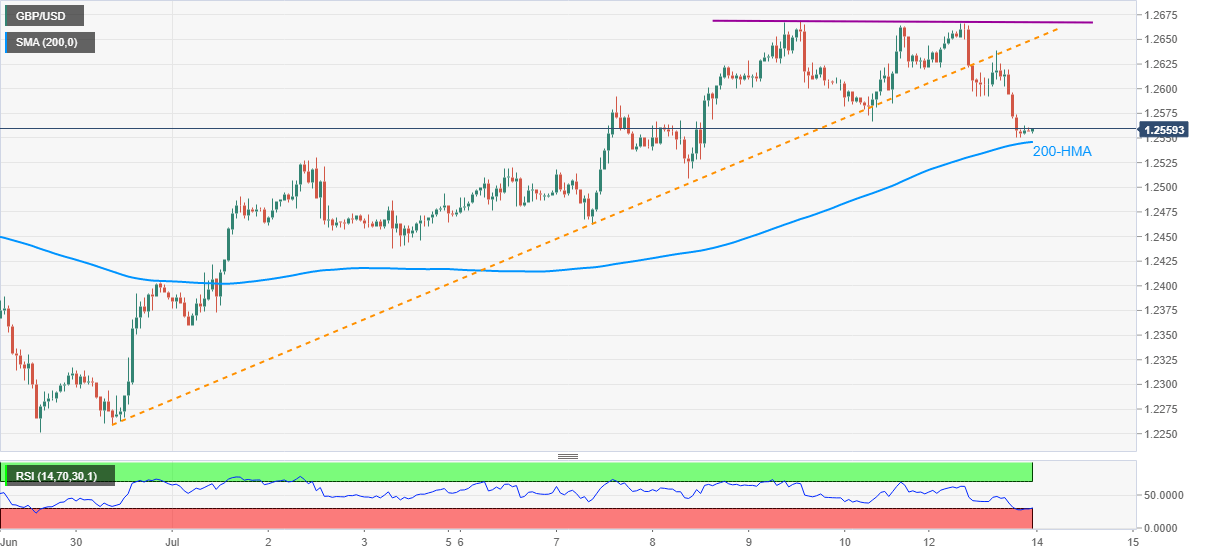
GBP/USD keeps the early-day bounce off 1.2550 while trading around 1.2560 ahead of the Tokyo open on Tuesday. Although the break of a two-week-old rising trend line dragged the quote to a four-day low, 200-HMA gain supports from oversold RSI conditions to challenge the bears.
As a result, the quote’s bounce to regain 1.2600 can’t be ruled out. However, any further upside depends upon how well the buyers manage to conquer 1.2665/70 area comprising highs marked on Thursday and Monday.
Should the bulls successfully clear 1.2670 resistance, 1.2715 and June month top near 1.2815 will be on their radars.
Meanwhile, a downside break below 200-HMA level of 1.2545 will attack 1.2500 round-figures to portray the bears’ dominance.
Though, July 03 low near 1.2435 will be the key during the quote’s additional weakness. The reason is that it holds the gate for the further south-run towards the sub-1.2400 area.
GBP/USD hourly chart
Trend: Pullback expected
