- GBP/USD bounces off 61.8% Fibonacci retracement.
- The monthly bottom could regain bears’ attention on the downside break.
- Buyers will have multiple upside barriers beyond the nearby resistance confluence.
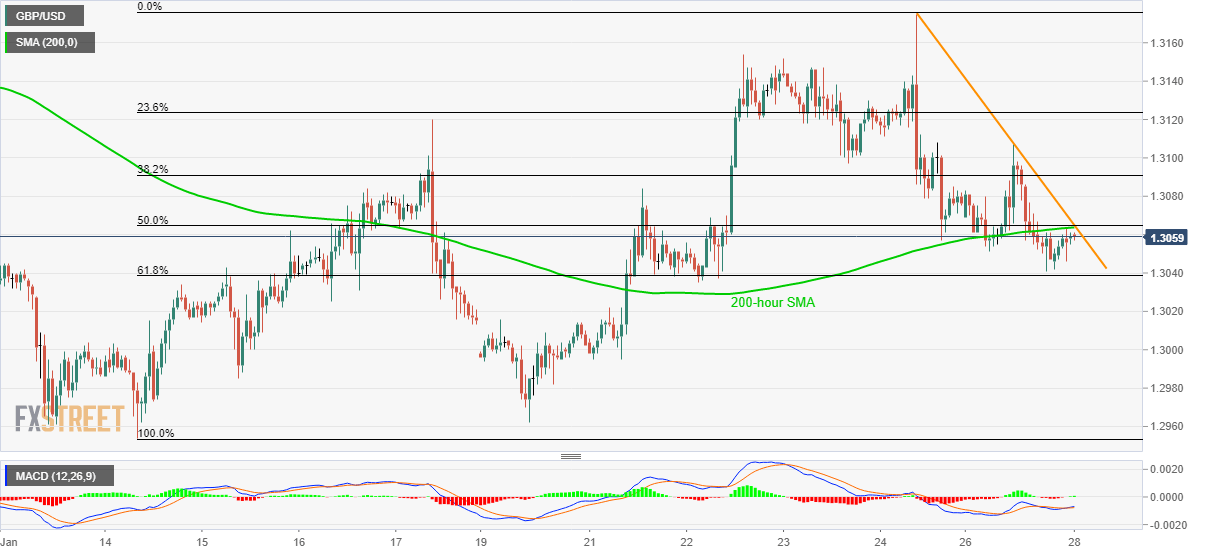
Following its failure to break 61.8% Fibonacci retracement of January 14-24 upside, GBP/USD pulls back to 1.3060 during the Asian session on Tuesday.
200-hour SMA and a falling trend line since Friday restrict the pair’s immediate upside around 1.3065, a break of which could accelerate the recovery towards 1.3105/10 area comprising multiple tops marked recently.
During the pair’s sustained run-up past-1.3110, 1.3150 and 1.3175 could lure the bulls.
Meanwhile, a downside break of 61.8% Fibonacci retracement, at 1.3038, will push the bears in the direction to 1.3000 mark.
However, the monthly bottom surrounding 1.2950 might question the sellers below 1.3000, if not then December month low near 1.2900 will be in focus.
GBP/USD hourly chart
Trend: Pullback expected
