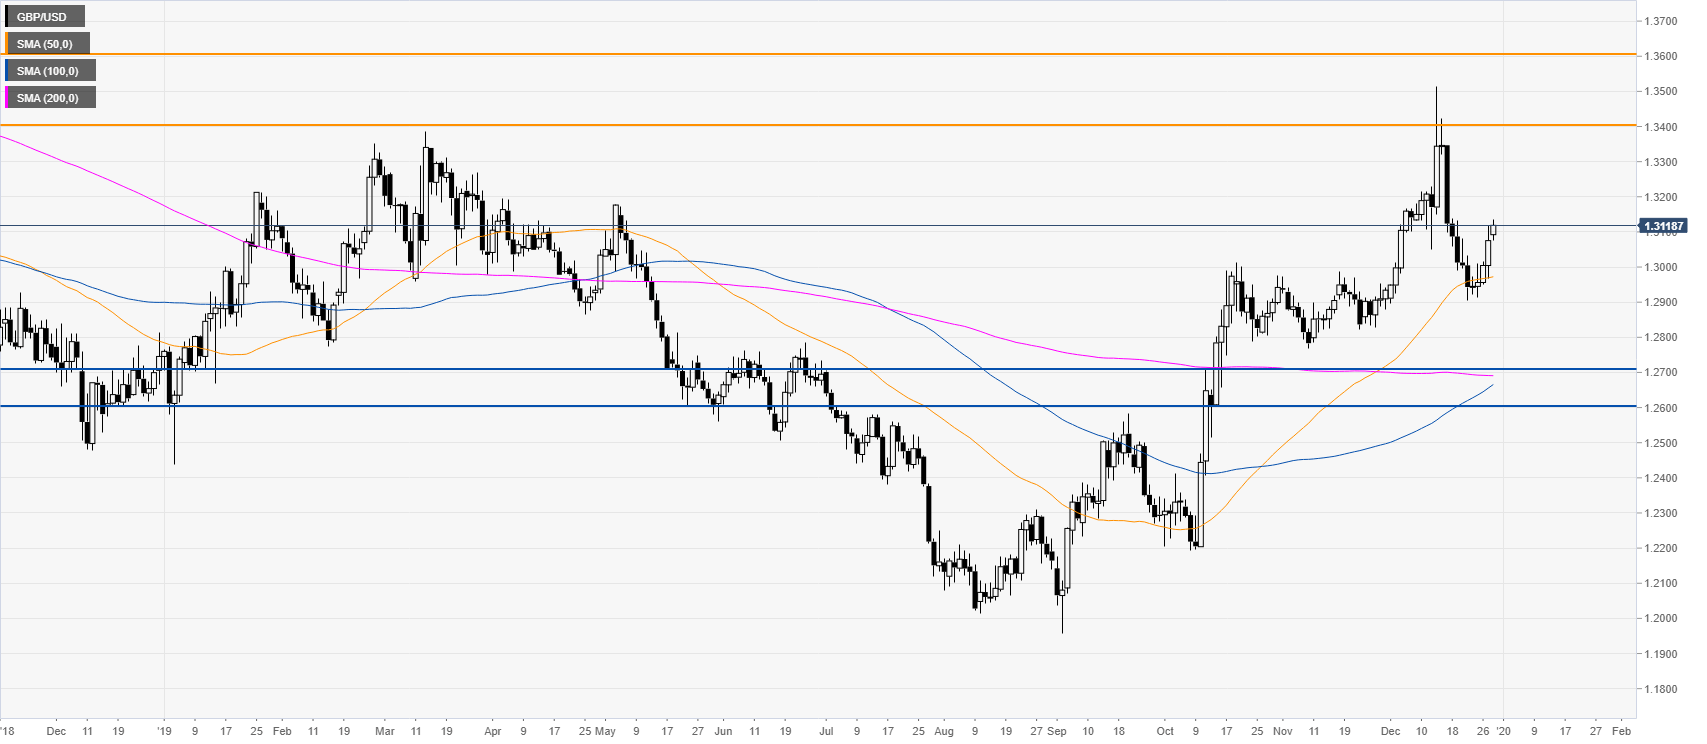
GBP/USD weekly chart
The cable is trading off the 2019 high above the 1.3000 big figure. The market is also challenging a downward sloping 200-period weekly simple moving average (SMA). Since August this year, the market essentially reversed course and 2019 can bee seen as a potential reversal year for the pound. If the buyers can have a weekly close above the 1.3400/1.3600 price zone in 2020, it would probably be a strong indication that further gains are on the cards.

GBP/USD daily chart
The spot is trading above a flat 200-day SMA while holding above the 50 SMA. However, the strong rejection near the 2019 highs can indicate further consolidation ahead. The current bullish bias would likely weaken on a daily close below the 1.2700/1.2600 price zone as this was an important support/resistance in the past year.
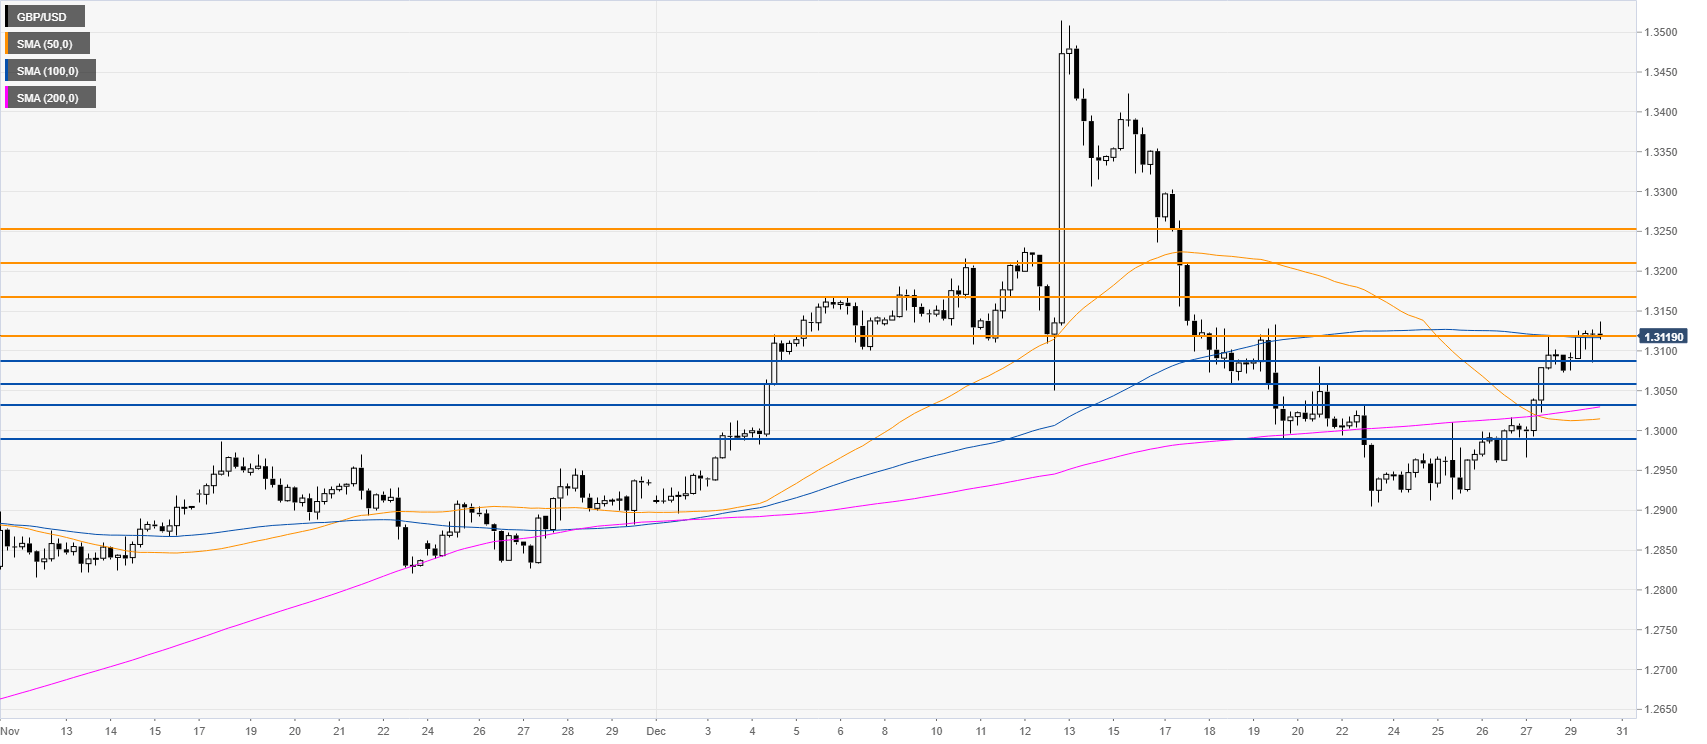
GBP/USD four-hour chart
The market is correcting the steep decline seen in mid-December and is now challenging the 1.3121 resistance near the 100 SMA on the four-hour chart. Bulls want to keep the pressure on the reach the 1.3169, 1.3210 and 1.3251 levels. Support is seen at the 1.3087, 1.3049, 1.3032 and 1.2991 levels according to the Technical Confluences Indicator.
Additional Key Levels
