- GBP/USD shows no major action near two-week high, seesaws around 1.2330/35.
- MACD turns bullish for the first time in 15 days.
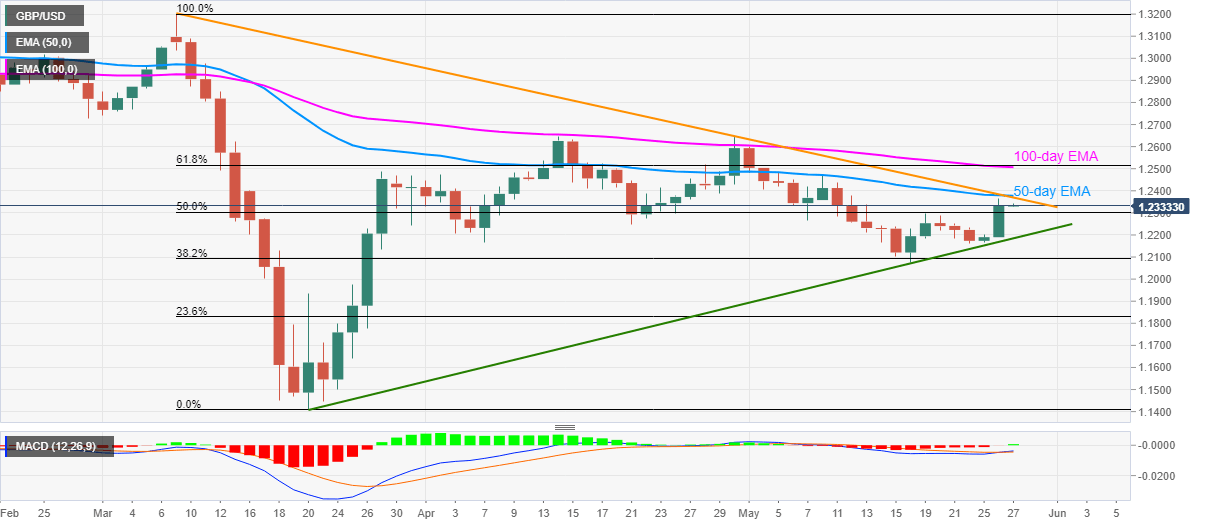
- A confluence of 50-day EMA, descending trend line from March 09 challenges the buyers.
Having flashed over 1.0% gains the previous day, GBP/USD buyers catch a breather around 1.2330/35 amid the early Asian session on Wednesday.
While bulls are cheering the MACD histogram’s favor after many days, fresh entries are likely awaiting the sustained break of 1.2370/80 area including 50-day EMA and a falling trend line from March 09.
Should the bulls manage to cross 1.2380 on a daily closing basis, 100-day EMA and 61.8% Fibonacci retracement of the pair’s March month’s declines, around 1.2505/15, will become the buyers’ favorite.
On the contrary, sellers will hesitate to enter unless witnessing a break below the ten-week-old rising support line, at 1.2370 now. Though, odds of the pair’s pullback to Monday’s top near 1.2200 can’t be ruled out.
GBP/USD daily chart
Trend: Bullish
