- GBP/USD registers fewer moves following two-day declines.
- Pair’s failure to stay above 23.6% Fibonacci retracement, 100-day SMA drags it to the key support.
- Highs marked during the late-2019, early-February act as the key resistances.
Having dropped decisively below key technical levels, GBP/USD seesaws around 1.2820 amid the Asian session on Thursday.
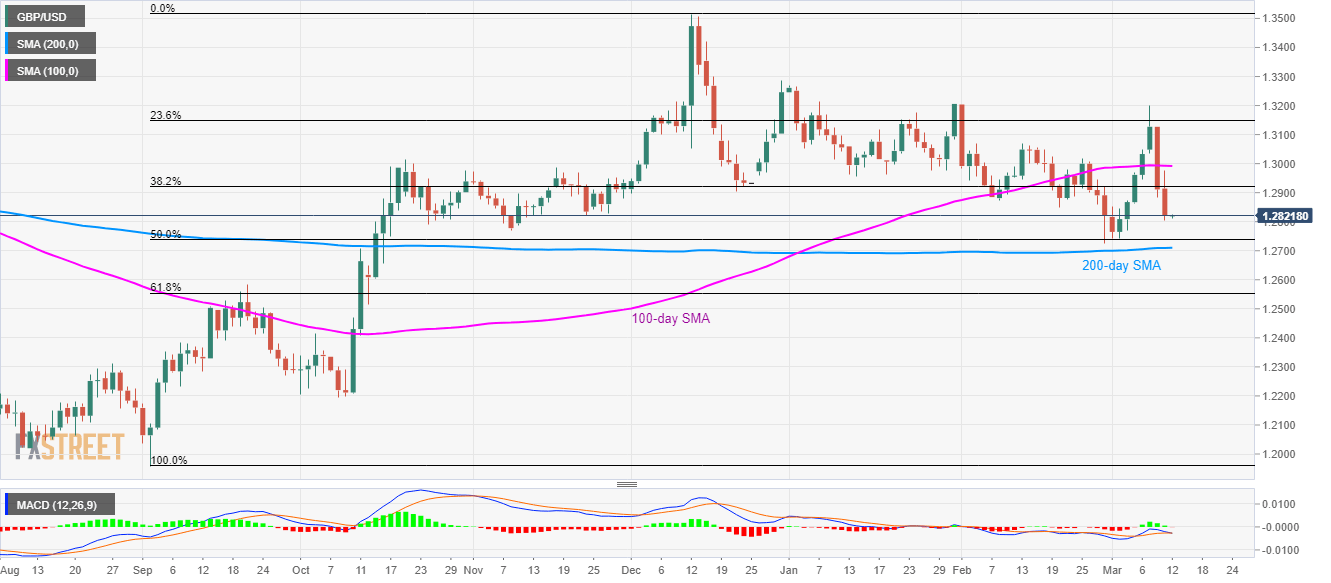
In addition to 23.6% Fibonacci retracement of the pair’s September-December 2019 upside, at 1.3150, 100-day SMA near 1.3000 also acts as the key upside barrier.
If at all the pair manage to cross 1.3150 on a daily closing basis, tops marked during the early February and late-December 2019, respectively near 1.3200 and 1.3285, can please the bulls.
On the contrary, 50% Fibonacci retracement and 200-day SMA, close to 1.2735 and 1.2710 in that order, can question short-term bears.
Given the bears’ dominance past-1.2710, 61.8% Fibonacci retracement near 1.2550 can return to the charts.
GBP/USD daily chart
Trend: Bearish
