- GBP/USD failed to preserve its intraday gains and retreated around 50 pips from daily tops.
- Mixed technical indicators on hourly/daily charts warrant some caution for bearish traders.
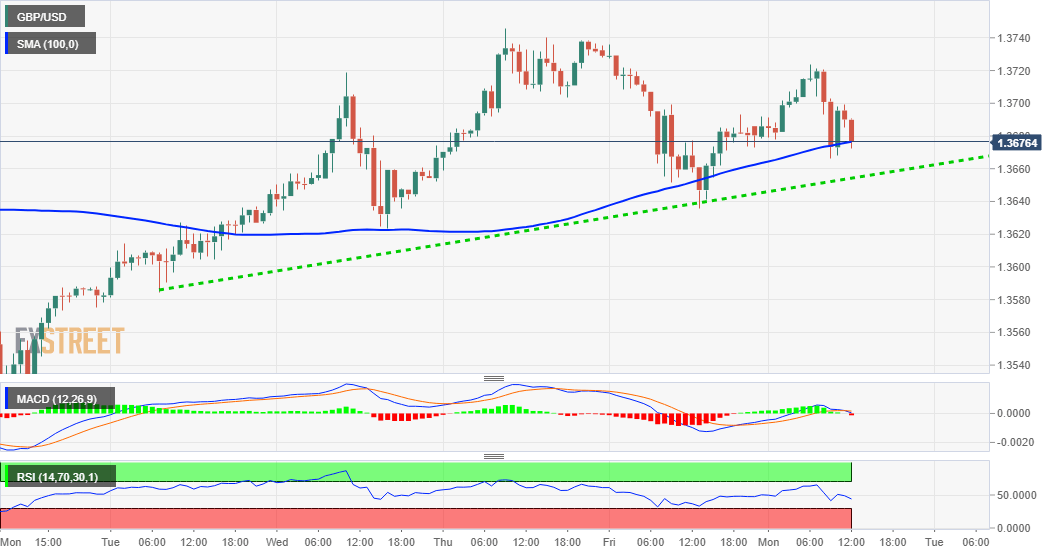
The GBP/USD pair struggled to capitalize on its early uptick and has now retreated around 50 pips from intraday swing highs, near the 1.3720-25 region. Despite the pullback, the pair, so far, has shown some resilience below 100-hour SMA.
Meanwhile, technical indicators on the 1-hourly chart have just started drifting into the negative territory. That said, oscillators on 4-hourly/daily charts – though have been losing positive momentum – are yet to confirm a bearish outlook.
This warrants some caution for aggressive bearish traders and before positioning for any further near-term corrective slide. Hence, the previous session’s low, around the 1.3635 region, should act as a pivotal point for short-term traders.
Below the mentioned support levels, the GBP/USD pair might turn vulnerable to break below the 1.3600 round-figure mark. The downward trajectory might then drag the GBP/USD pair back towards the 1.3520 region, or last week’s swing lows.
On the flip side, the 1.3700 round-figure mark now becomes immediate strong resistance. This is closely followed by daily tops, around the 1.3720-25 region ahead of mid-1.3700s, or multi-year highs touched last Thursday.
A sustained move beyond should pave the way for an extension of the recent strong bullish momentum and push the GBP/USD pair beyond the 1.3800 round-figure mark. The next relevant target on the upside is pegged near the 1.3840 region, which marks the top boundary of a four-month-old upward sloping channel.
GBP/USD 1-hourly chart
Technical levels to watch
