- GBP/USD extends four-day losing streak into Friday’s trading.
- Ascending trendline support at 1.3704 is a level to beat for the GBP bears.
- Bearish RSI keeps the 100-DMA target at 1.3686 on the sellers’ radars.
GBP/USD is licking its wound below 1.3750, holding within Thursday’s trading range, as the bears await a strong catalyst for the next push lower.
The daily chart for the cable offers strong support at the two-month-old ascending trendline support at 1.3704, as the bearish Relative Strength Index (RSI) adds credence to the further downside.
A firm break below that support could expose the upward-sloping 100-DMA at 1.3686, which remains on the sellers’ radars after the price confirmed a bear cross earlier this week.
GBP/USD: Daily chart
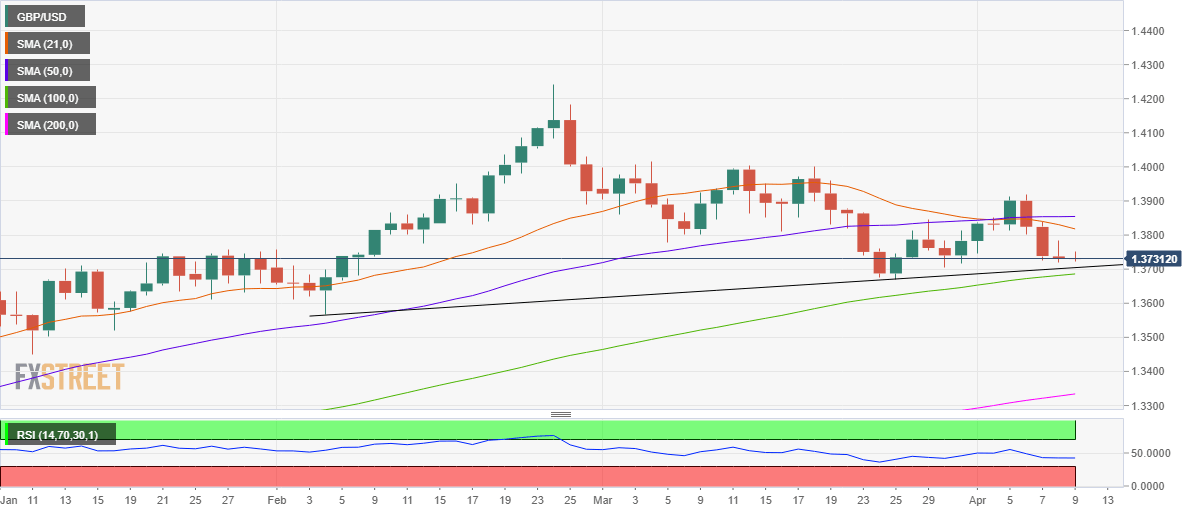
A bearish crossover on the said timeframe got confirmed after the 21-DMA pierced through the 50-DMA from above.
On the flip side, the GBP bulls need to take out Thursday’s high at 1.3783 in order to extend the bounce towards the bearish 21-DMA at 1.3818.
Further up, the 50-DMA at 1.3854 would be the level to beat for the bulls.
GBP/USD: Additional levels
