- GBP/USD remains positive, above 21/50-day SMA confluence.
- December 31, 2019 top will cap upside following 23.6% Fibonacci retracement.
- 38.2% Fibonacci retracement, six-week-old rising trend line add to the support.
Despite offering a gap-down opening to 1.3175, from Friday’s close of 1.3205, GBP/USD gradually recovers to 1.3185, amid bullish MACD, by the press time of the early Asian session on Monday.
Even so, the quote stays below 23.6% Fibonacci retracement of its October-December 2019 upside, at 1.3205. The pair failed to close beyond the same during its last week’s rally.
With this, a confluence of 21 and 50-day SMAs near 1.3080/90 grabs the sellers’ attention ahead of 38.2% Fibonacci retracement and an upward sloping trend line from December 23, respectively near 1.3010 and 1.2985.
On the upside, a daily closing beyond 1.3205 level of 23.6% Fibonacci retracement could recall December 31 top of 1.3285 whereas the December month’s high near 1.3515 will gain buyers’ attention then after.
GBP/USD daily chart
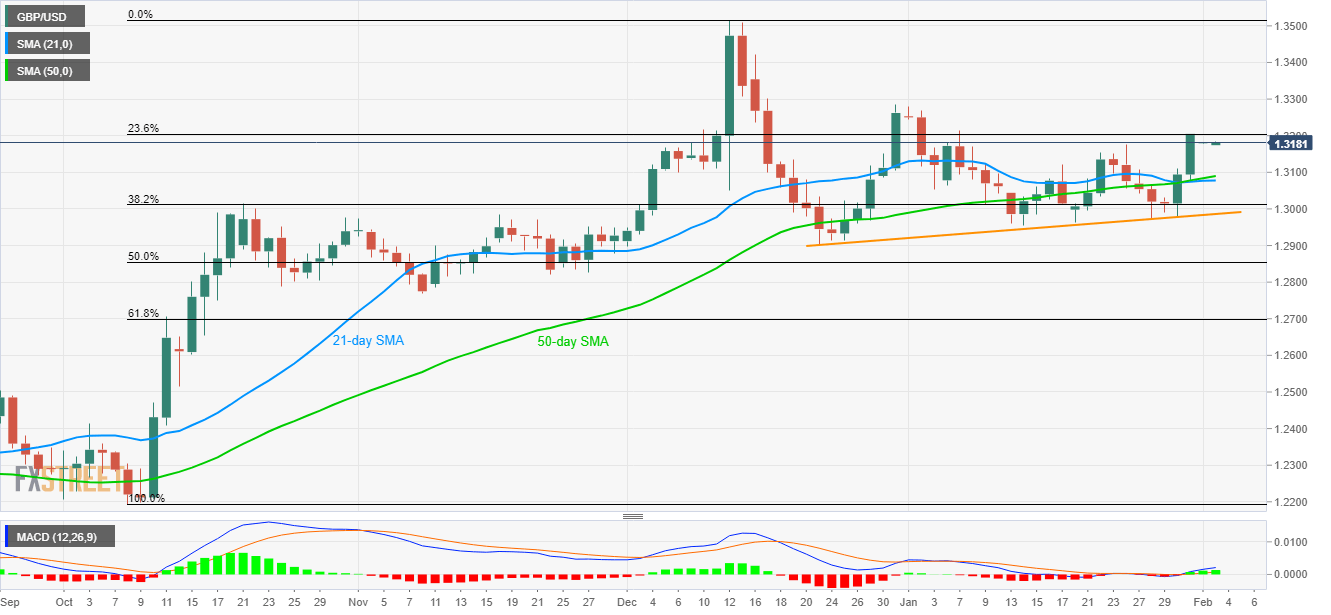
Trend: Sideways
