- GBP/USD snaps two-day losing streak.
- 61.8% Fibonacci retracement on bull’s radar ahead of three-week-old resistance line.
- Monthly rising trend line, 50% Fibonacci retracement add to support.
GBP/USD recovers 0.08% after the previous two-day drop while taking rounds to 1.2455 in early Tuesday’s trading.
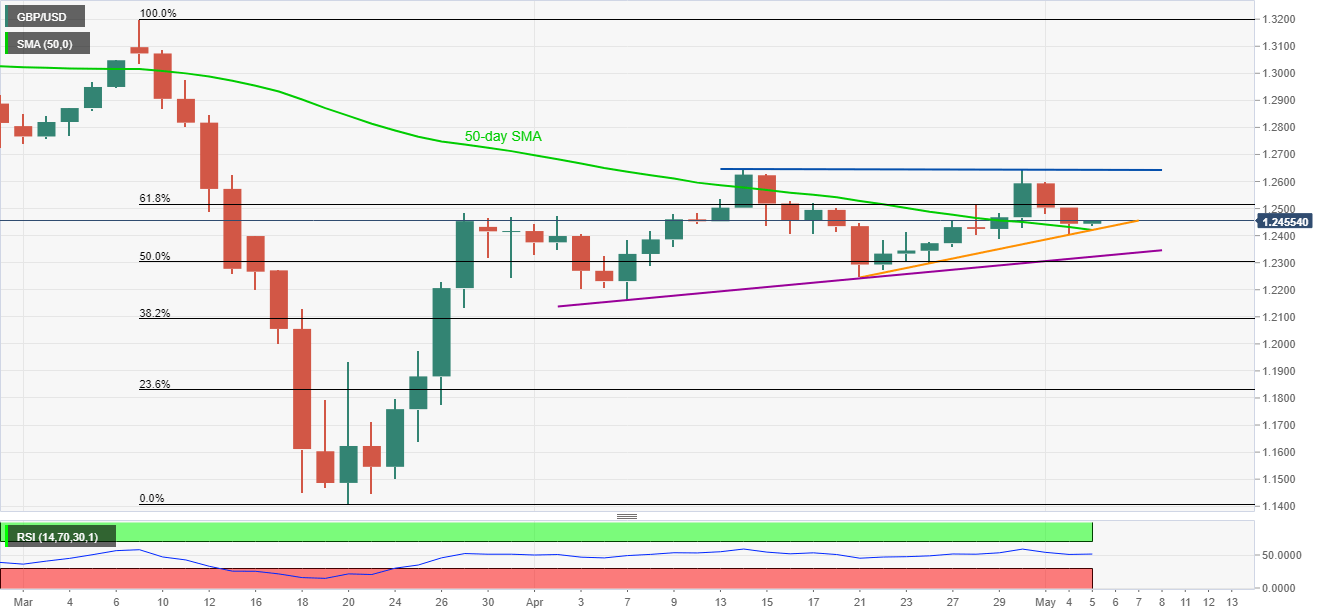
The pair bounces off a joint comprising 50-day SMA and a two-week-old rising trend line, which in turn propels the moves towards 61.8% Fibonacci retracement of March month fall, around 1.2515.
However, a horizontal line stretched from April 14, close to 1.2640/45, could restrict the pair’s upside past-1.2515.
Meanwhile, an ascending trend line since April 07, 2020, at 1.2320, followed by a 50% Fibonacci retracement of 1.2300, could limit the GBP/USD pair’s declines below 1.2420 support confluence.
GBP/USD daily chart
Trend: Further recovery expected
