- GBP/USD holds onto recovery gains above short-term key EMA.
- 61.8% Fibonacci retracement lures the buyers.
- 100-day and 200-day EMAs add barriers to the upside.
- 50% Fibonacci retracement, monthly low will be on the sellers’ radar during fresh downside.
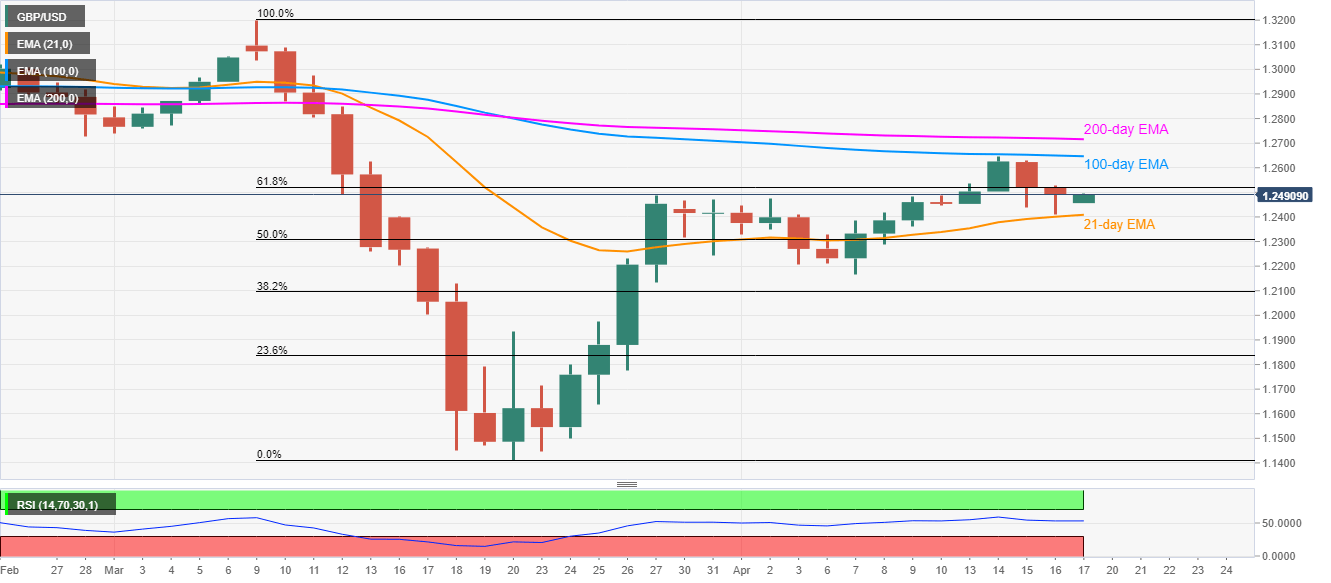
While bouncing off 21-day EMA, GBP/USD takes the bids to 1.2490 during the early Asian session on Friday.
The Cable currently rises towards 61.8% Fibonacci retracement of March month upside, at 1.2520, whereas 100-day and 200-day EMA levels, respectively around 1.2650 and 1.2720, could challenge buyers afterward.
If at all the bulls manage to conquer 200-day EMA, February month low near 1.2725 validates the further upside towards March top surrounding 1.3200.
Alternatively, 50% Fibonacci retracement level and the month’s low, around 1.2310 and 1.2165 in that order, will be the sellers’ target if the quote closes below the immediate support near 1.2405/2400.
GBP/USD daily chart
Trend: Further recovery expected
