- GBP/USD snaps two-day losing streak.
- 10-day and 21-day SMA limit immediate moves below the monthly resistance line.
- March 20 top on bears’ radar during further declines.
Despite bouncing off one-week low, GBP/USD remains within 10-day and 21-day SMA area while taking rounds to 1.2238, up 0.05%, amid the Asian session on Tuesday.
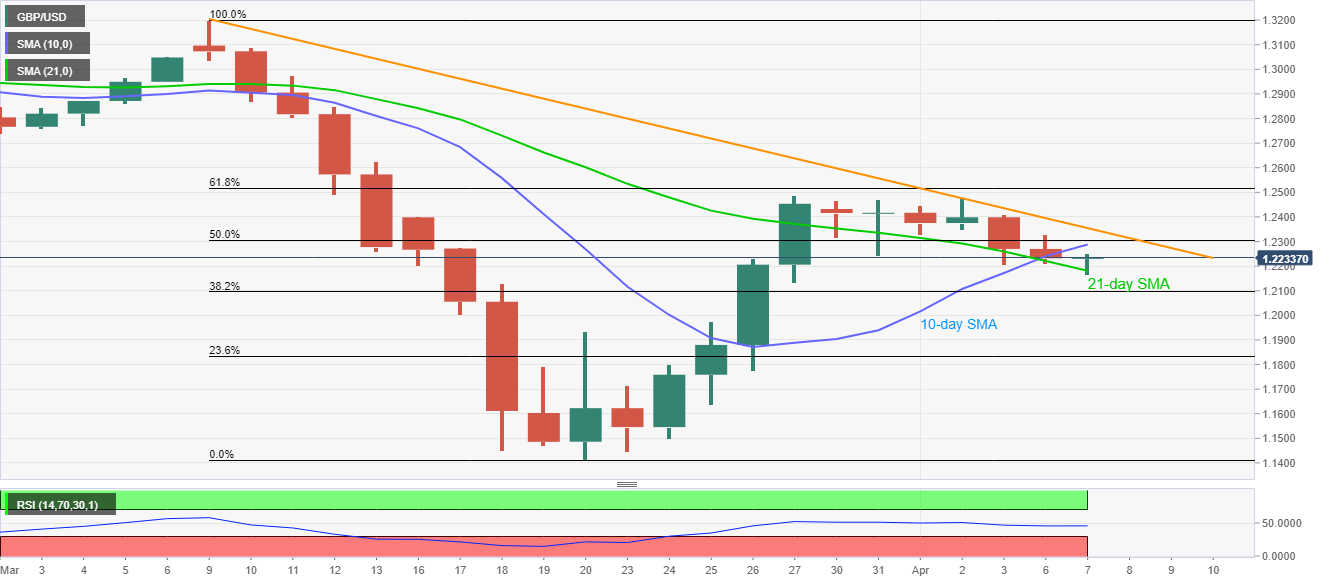
While the pair’s latest pullback from 21-day SMA propels it towards a 10-day SMA level of 1.2290, 50% Fibonacci retracement of the previous month’s drop as well as a four-week-old falling trend line, respectively near 1.2305 and 1.2355, could challenge the buyers.
Should there be a clear run-up past-1.2355, the pair buyers will target 61.8% Fibonacci retracement level of 1.2520.
Alternatively, a daily close below 21-day SMA level of 1.2180 will gradually drag the quote towards 1.20000 mark ahead of highlighting March 20 top near 1.1935.
GBP/USD daily chart
Trend: Bearish
