- GBP/USD staged a goodish intraday bounce of around 85 pips from sub-1.3000 levels.
- The intraday positive move stalled near a three-day-old descending trend-line resistance.
- The technical set-up still favours bullish traders and supports prospects for additional gains.
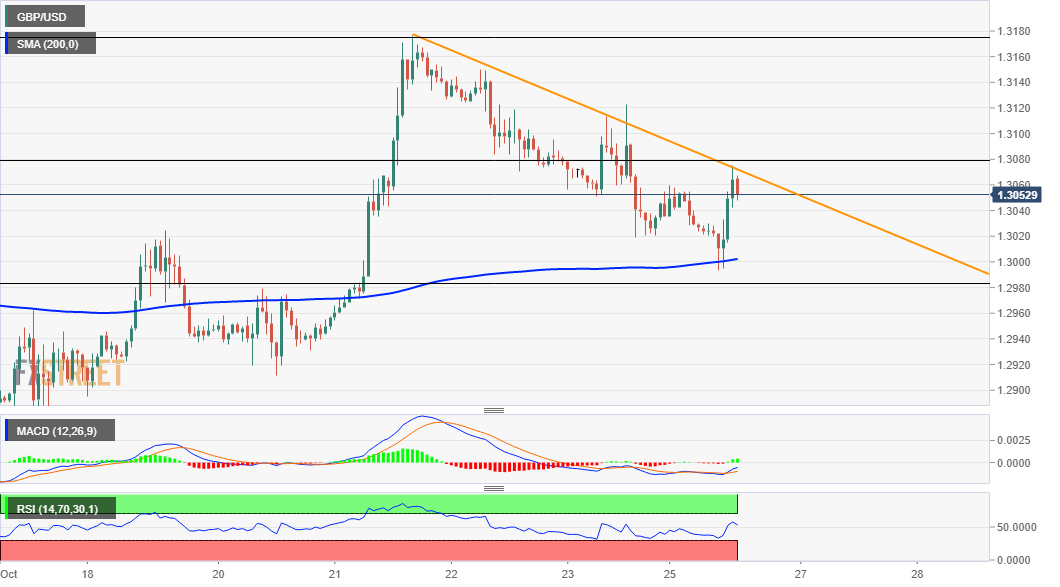
The GBP/USD pair showed some resilience below 200-hour SMA and staged a goodish intraday bounce of around 85 pips from levels below the key 1.3000 psychological mark. The momentum pushed the pair to fresh session tops, around the 1.3075 region in the last hour, albeit stalled near a three-day-old descending trend-line resistance.
Meanwhile, technical indicators on the 1-hourly chart have again started moving into positive territory. Adding to this, bullish oscillators on daily/4-hourly charts now support prospects for a further near-term appreciating move. That said, bulls might still need to wait for a sustained move beyond the mentioned trend-line hurdle.
A convincing breakthrough has the potential to lift the GBP/USD pair beyond the 1.3100 round-figure mark, towards testing last week’s daily closing highs resistance near the 1.3140-45 region. This is closely followed by a resistance marked by the 61.8% Fibonacci level of the 1.3482-1.2676 pullback, or the recent swing highs near the 1.3175 region.
Some follow-through buying will be seen as a fresh trigger for bullish traders and pave the way for a move to retest the 1.3235 horizontal resistance. The momentum could further get extended towards the 1.3300 mark en-route the next major hurdle near the 1.3320 region.
On the flip side, immediate support is now pegged near the 1.3020 region ahead of the 1.3000 mark (200-hour SMA) and 38.2% Fibo. level, around the 1.2980 region. Failure to defend the mentioned support levels will support prospects for an extension of the recent downfall and accelerate the fall towards the 1.2900 round-figure mark.
Some follow-through selling will negate any near-term positive bias and turn the pair vulnerable. Bears might then drag the pair below the 23.6% Fibo. level, around the 1.2865 area, and the 1.2800 mark, towards challenging the very important 200-day SMA, around the 1.2710-1.2705 zone.
GBP/USD 1-hourly chart
Technical levels to watch
