- GBP/USD stuck in a range between key average on the hourly chart.
- The cable could see a steep drop below 200-HMA.
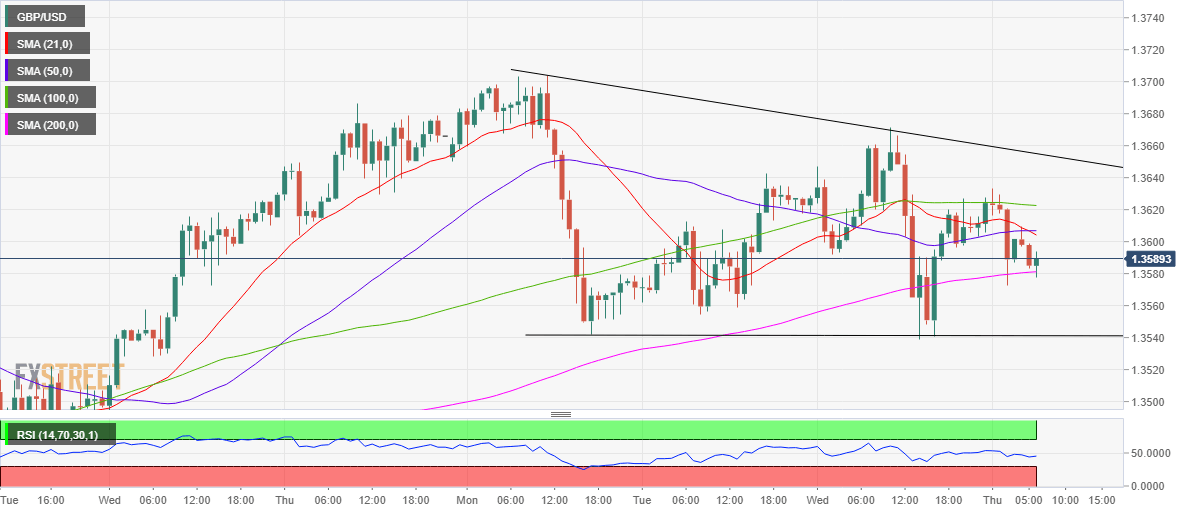
- RSI ticks up but remains below the midline.
GBP/USD is trading below 1.3600 ahead of the European open, having failed to find acceptance above the latter earlier in the Asian session.
From a technical perspective, the horizontal 100-hourly moving average (HMA) at 1.3622 continued to offer stiff resistance to the bulls.
Subsequently, the price tumbled and breached the 21 and 50-HMAs in a bid to test the 200-HMA cushion at 1.3580.
The price has managed to defend the 200-HMA although the bounce appears capped by the bearish crossover, with the 21-HMA having cut the 50-HMA from above.
Therefore, the cable risks extending the declines should the 200-HMA support give way. The next relevant downside target is seen at the ascending trendline support at 1.3541.
Alternatively, the 100-HMA barrier is the level to beat for the bulls. Further up, the descending trendline resistance at 1.3655 could challenge the recovery momentum.
The hourly Relative Strength Index (RSI) points north but remains below the 50 level, suggesting that the bearish bias still remains intact.
GBP/USD: Hourly chart
GBP/USD: Additional levels
