- GBP/USD bounces off 1.2585 to again challenge April top near 1.2650.
- RSI divergence on the 4-hour chart also questions further upside.
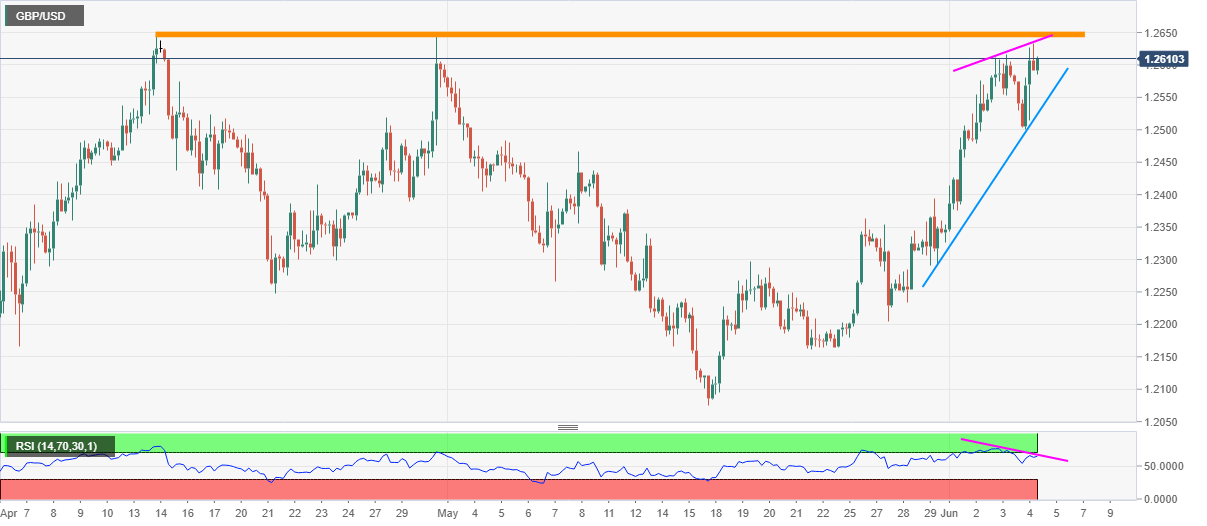
- One-week-old support line restricts immediate declines below 1.2585.
GBP/USD prints 0.11% gains while taking the bids near 1.2610 during the early Friday’s Asian session. Even so, the Cable stays below the 1.2640/50 horizontal area comprising highs marked in April month.
Other than the strong upside barrier around 1.2640/50, bearish RSI divergence also increases the odds for the pair’s pullback.
In doing so, an ascending trend line from May 29, at 1.2525 now, will act as immediate support, a break of which can recall 1.2500 and May 05 top near 1.2485 on the chart.
If at all the bears remain dominant past-1.2485, 1.2465 holds the key to the quote’s further downside towards May 12 high near 1.2375/80.
Alternatively, the pair’s run-up past-1.2650 enables it to challenge 1.2700 while also aiming for February 2020 low close to 1.2725.
GBP/USD four-hour chart
Trend: Pullback expected
