- GBP/USD caught some aggressive bids on Monday and surged past the 1.3400 mark.
- The strong move sums up to over 300 pips of recovery from Friday’s one-month lows.
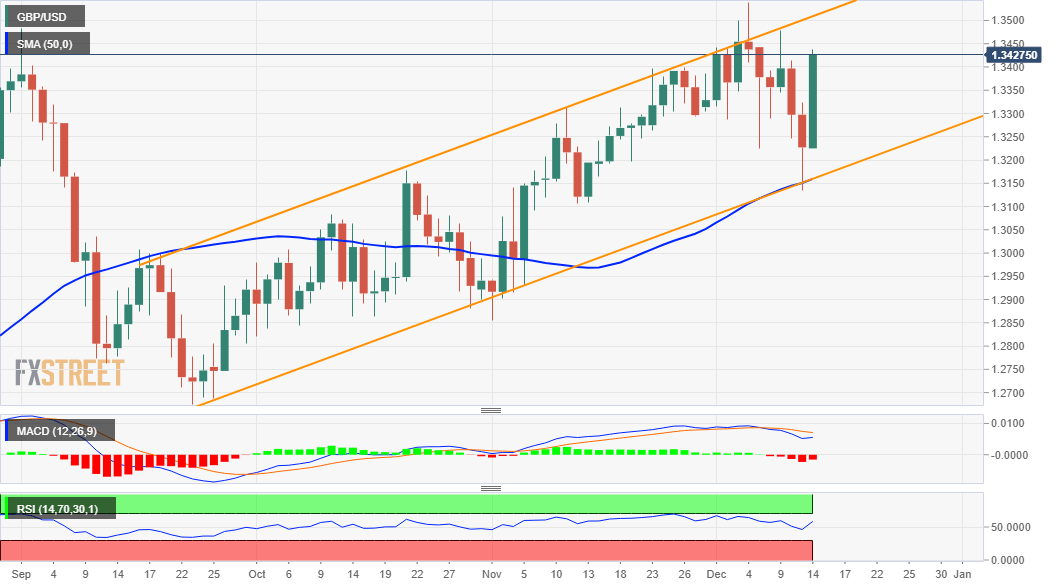
- The technical set-up favours bullish traders and supports prospects for further gains.
The GBP/USD pair built on its weekly bullish gap opening and continued gaining strong positive traction through the mid-European session.
The momentum pushed the pair further beyond the 1.3400 mark, summing up to a recovery of over 300 pips from one-month lows, around the 1.3135 area touched on Friday. The mentioned region marked an important confluence support – comprising of 50-day SMA and the lower end of a short-term ascending trend-channel.
Meanwhile, oscillators on the daily chart maintained their bullish bias and are still far from being in the overbought territory. The set-up favours bullish traders and supports prospects for additional gains. Hence, some follow-through strength, back towards the 1.3500 psychological mark, looks a distinct possibility.
Any subsequent move up is more likely to confront a stiff resistance near the top boundary of the mentioned channel, currently pegged near the 1.3530 region. A sustained move beyond will be seen as a fresh trigger for bulls and pave the way for an extension of the appreciating move witnessed over the past two-and-half months.
On the flip side, the 1.3400 round-figure mark now seems to act as immediate support. Any further weakness might be seen as a buying opportunity. This, in turn, should help limit the downside near mid-1.3300s. Failure to defend the mentioned levels could accelerate the slide to retest daily lows, around the 1.3300-1.3290 region.
Some follow-through selling will negate the near-term constructive outlook and turn the pair vulnerable to break below the 1.3200 round-figure mark. The downward trajectory might then drag the pair further towards challenging the 50-DMA/ascending channel confluence support, currently pegged near the 1.3170-60 zone.
GBP/USD daily chart
Technical levels to watch
