- Monthly and daily resistance puts a focus o the dowside.
- GBP/USD bears looking for a break of hourly support and 21-SMA.
GBP/USD is testing a critical resistance level on the daily chart and can be expected to melt back towards weekly support on repeated failures at this juncture.
The following is a top-down analysis across the time frames which illustrates the market structure and possible near-term trajectory.
Monthly chart
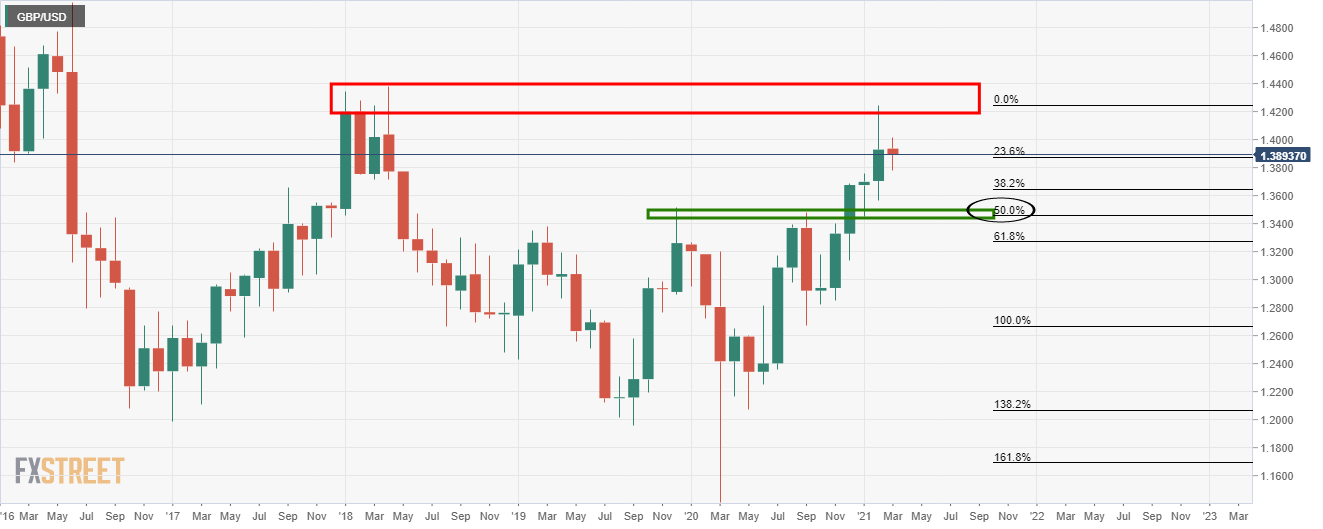
The monthly chart shows that the price is being resisted in a key supply area with a focus on a significant retracement towards monthly support.
Weekly chart
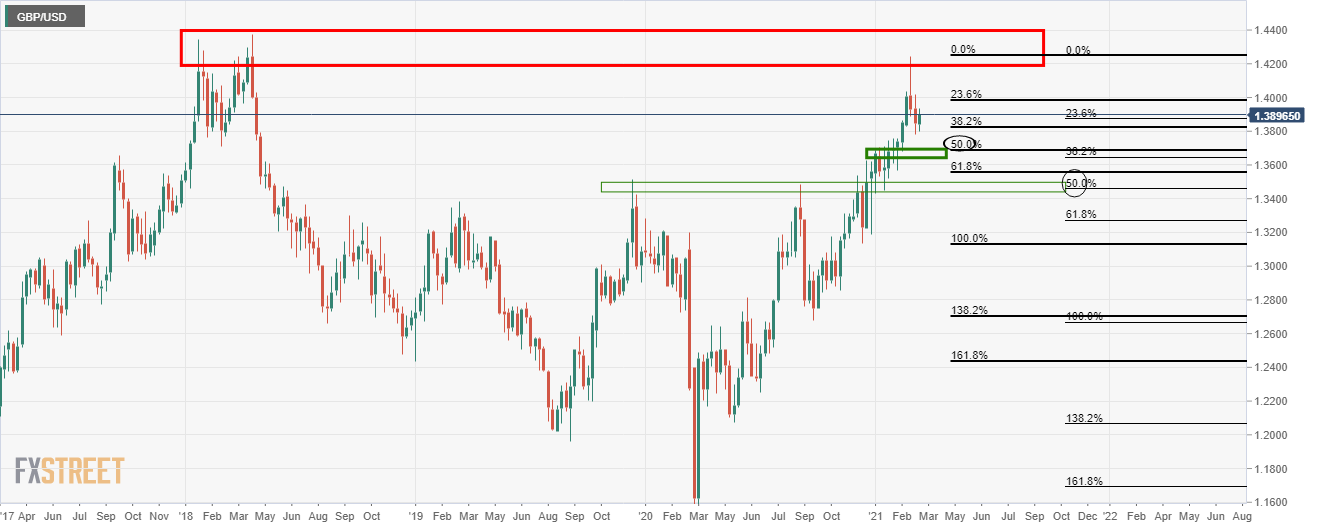
Meanwhile, from a weekly perspective, the price is in the process of the downside with eyes on a 50% mean reversion.
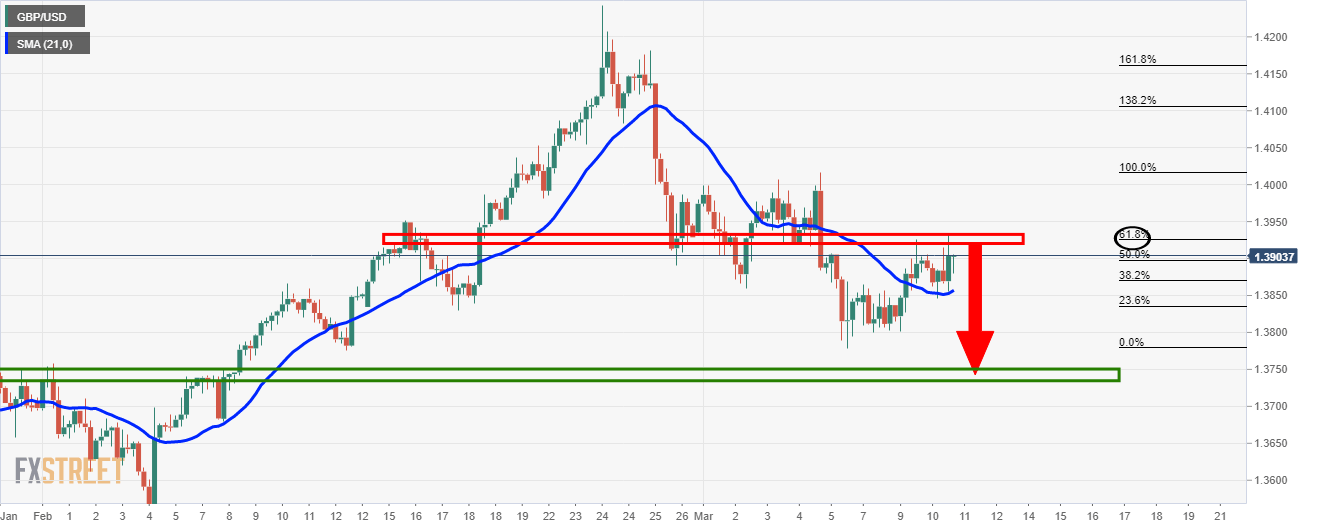
Daily chart
The daily chart shows that the price has already tested the M-formation’s neckline at a 61.8% Fibonacci confluence and can now be expected to extend the latest bearish daily impulse.
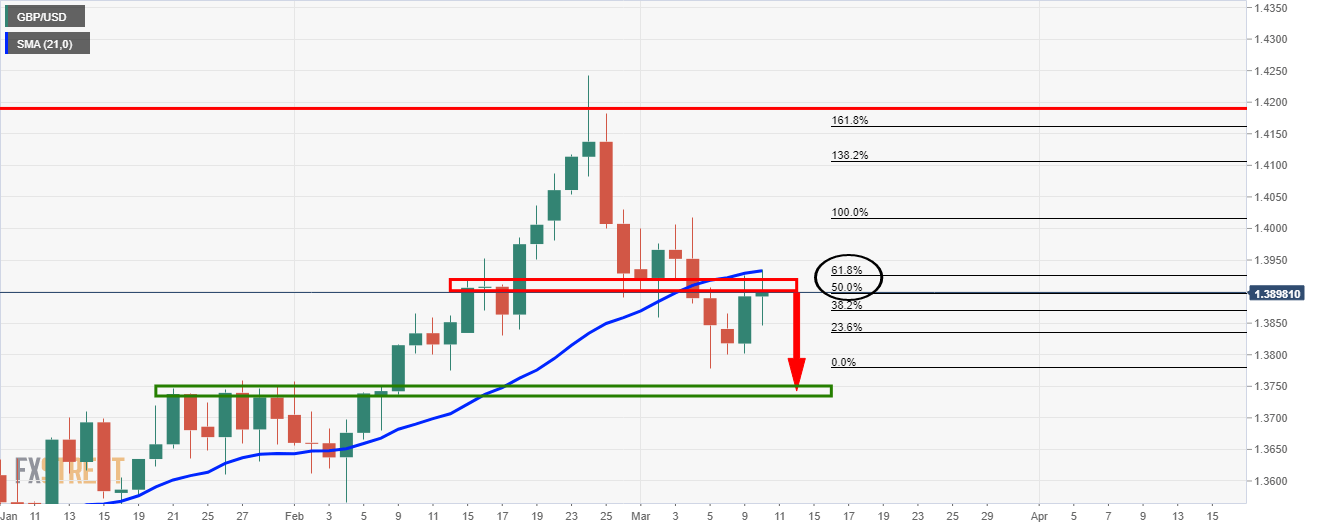
4-hour chart
The 4-hour chart remains in the bullish territory while above the 21-SMA and bears will be on the lookout for bearish structure in the lower time frames.
1-hour chart
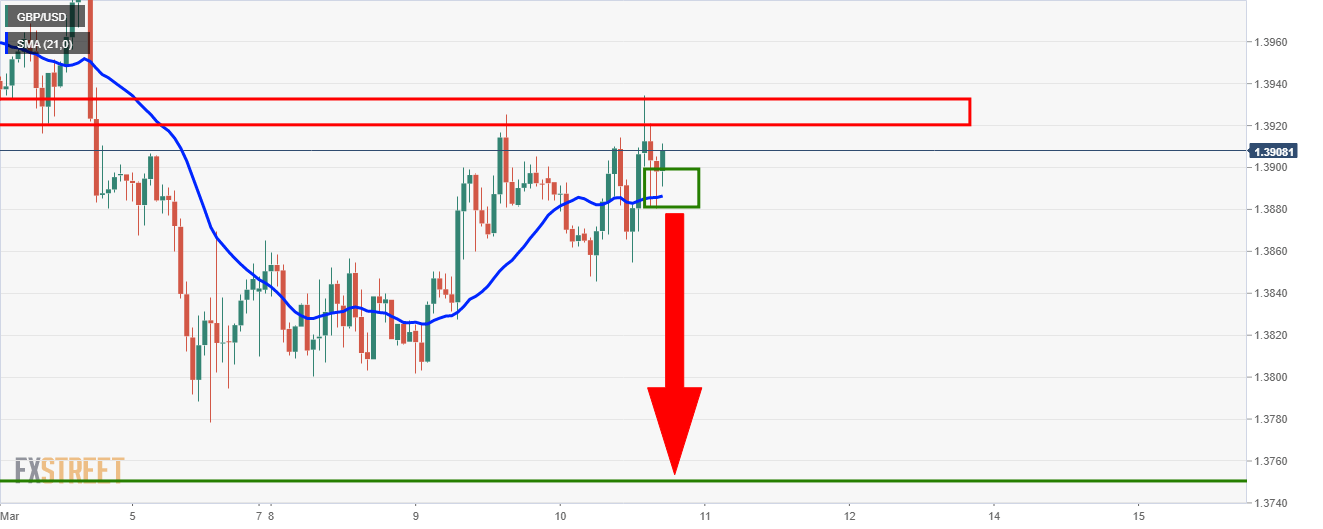
The bears will be looking for a break below the support structure and 21-SMA. A restest of the structure will offer a discount for the bears seeking out the 1.3750’s.
