- GBP/USD probes the highest since May 2018, flashed on Wednesday.
- Upper line of short-term channel, 2.5-month-long ascending trend line probe upside momentum.
- Bears will refrain entries unless breaking bullish chart pattern.
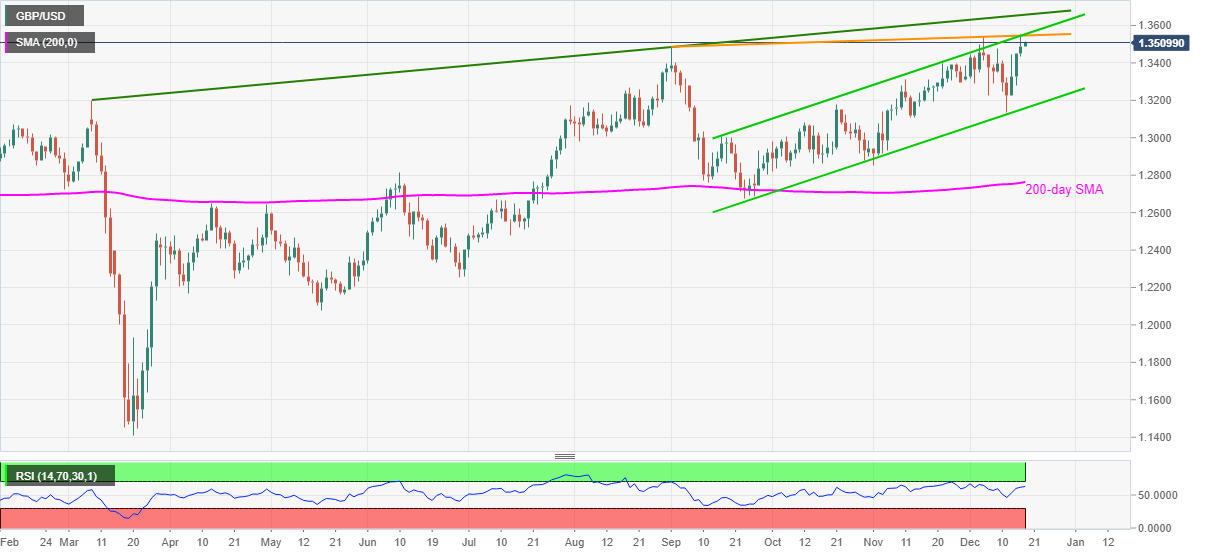
GBP/USD buyers attack an intraday high of 1.3512, up 0.18% on a day, during Thursday’s Asian session. The cable rose to the fresh multi-month high the previous day while staying inside an ascending trend channel formation establishes since mid-September.
Though, a rising trend line connecting highs marked from September 01, at 1.3546 now, challenges the pair’s further upside.
As a result, the GBP/USD prices may witness a pullback unless successfully crossing the immediate resistance line and the upper line of the stated channel, respectively around 1.3545 and 1.3555.
In a case where the bulls manage to cross the 1.3555 mark on a daily closing, an upward sloping trend line from March 2020, near 1.3660, will be in the spotlight.
On the flip side, 1.3515 and December 11 top near 1.3325 can offer immediate supports during GBP/USD pullback.
It should, however, be noted that the bears are less likely to get serious unless witnessing a downside break of channel support, at 1.3158 now.
GBP/USD daily chart
Trend: Pullback expected
