- GBP/USD looks for clear directions amid broad bearish trend.
- Monday’s candlestick suggesting a trend reversal, oversold RSI question the sellers.
- Buyers will wait for a sustained break of 200-day SMA for entry.
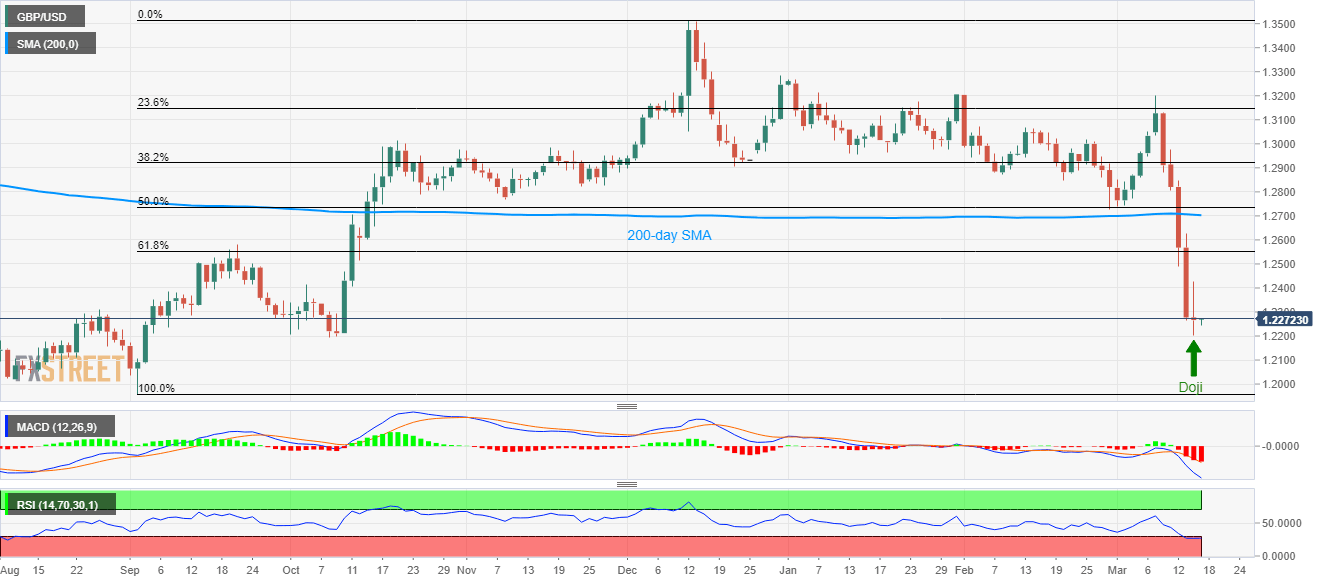
Having flashed a Doji candlestick formation on the daily (D1) chart, GBP/USD seesaws near 1.2270 during the Asian session on Tuesday.
The Cable searches for the clear catalyst as bearish MACD signals and trading below 200-day SMA keeps the sellers in command whereas a candlestick formation indicating trend reversal and oversold RSI pushes the buyers to look for entry.
Monday’s top near 1.2425 and 61.8% Fibonacci retracement of the pair’s September-December 2019 upside, around 1.2555, can offer nearby resistances to the quote ahead of 200-day SMA level of 1.2700.
In a case where the bulls manage to conquer 1.2700, November 2019 bottom surrounding 1.2820 will be on their radars.
Meanwhile, October 219 low near 1.2195 holds the key to the pair’s further downside, which if broken could drag the quote towards 1.2100 and then to September 2019 low surrounding 1.1960.
GBP/USD daily chart
Trend: Pullback expected

