- GBP/USD charted a Doji candle on Wednesday, neutralizing the immediate bearish outlook.
- Tuesday’s low is now the level to beat for the bears.
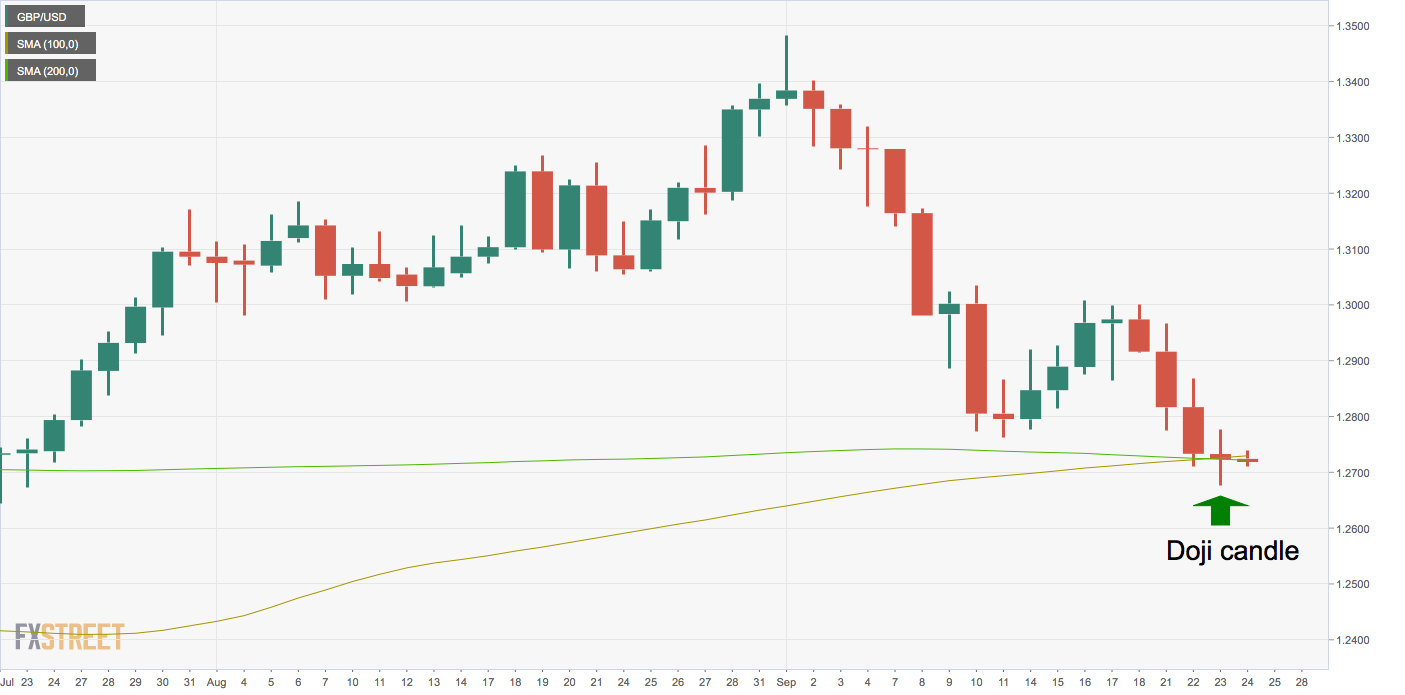
GBP/USD created a Doji candle at the confluence of the 200- and 100-day simple moving averages (SMA) on Wednesday.
A Doji candle occurs when an asset sees two-way business but ends the day on a flat note. It is considered a sign of indecision.
In GBP/USD’s case, the Doji candle has appeared following a notable sell-off from 1.3483 to 1.2675 and at the 200-day SMA support line. As such, it could be taken to represent seller exhaustion.
That said, a bullish reversal would be confirmed if the pair ends Thursday above the Doji candle’s high of 1.2777. Alternatively, acceptance below the Doji’s low of 1.2675 would imply a continuation of the sell-off from 1.3483.
At press time, the pair is trading at 1.2722, a level housing the 100- and 100-day SMAs.
Daily chart
Trend: Neutral
Technical levels
