- GBP/USD is easing after the end of December bullish run.
- The retracement down can extend further on a break below the 1.3134 level.
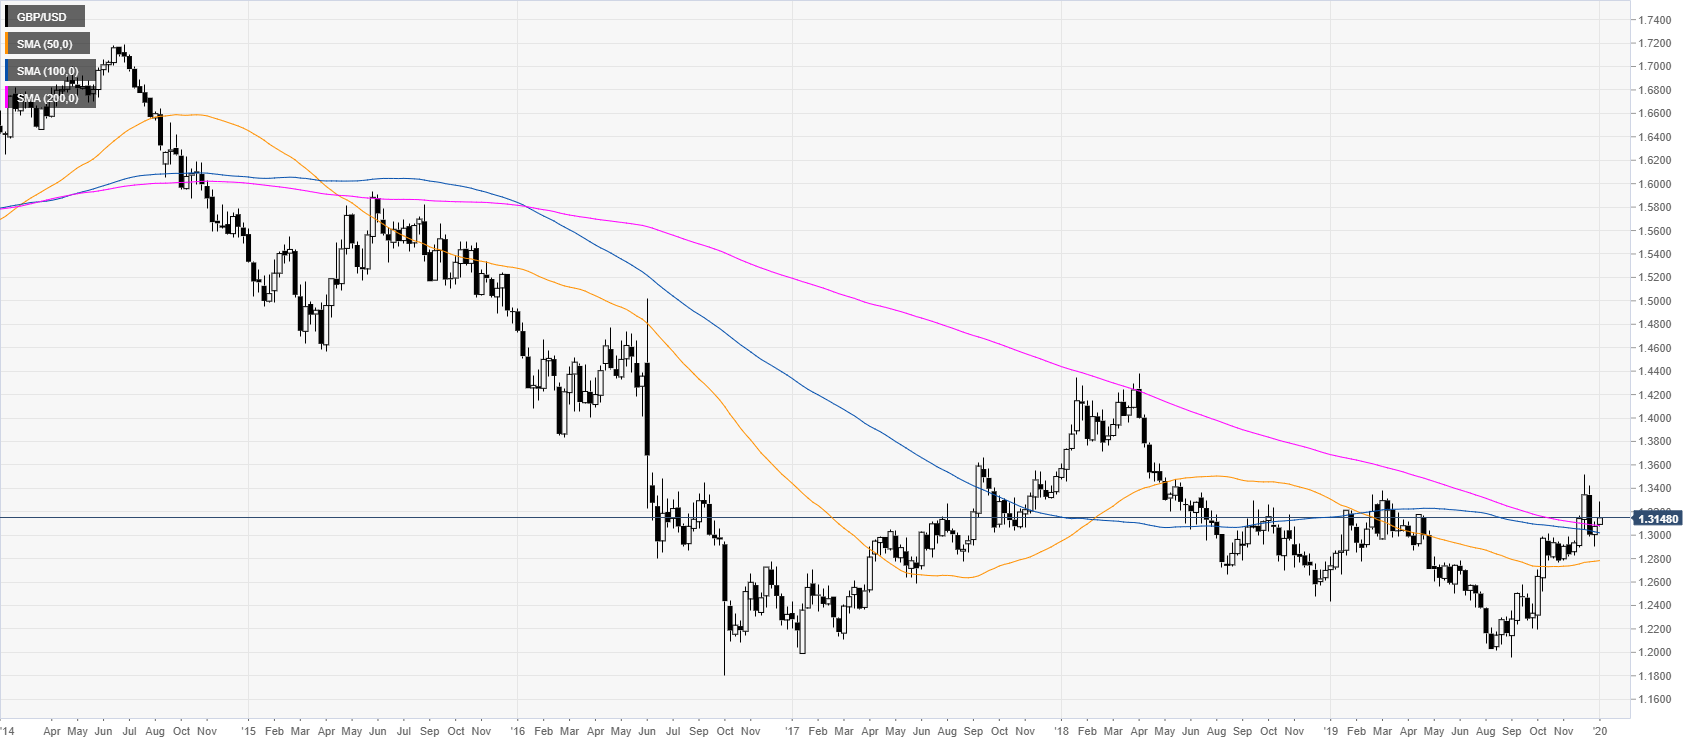
GBP/USD weekly chart
The spot is easing from the 2019 high above the 1.3000figure. GBP/USD is also challenging a downward sloping 200-period weekly simple moving average (SMA). Since August 2019, the market is reversing up. If the bulls can have a weekly close above the 1.3400/1.3600 price zone, it would likely be a strong indication for further gains ahead.
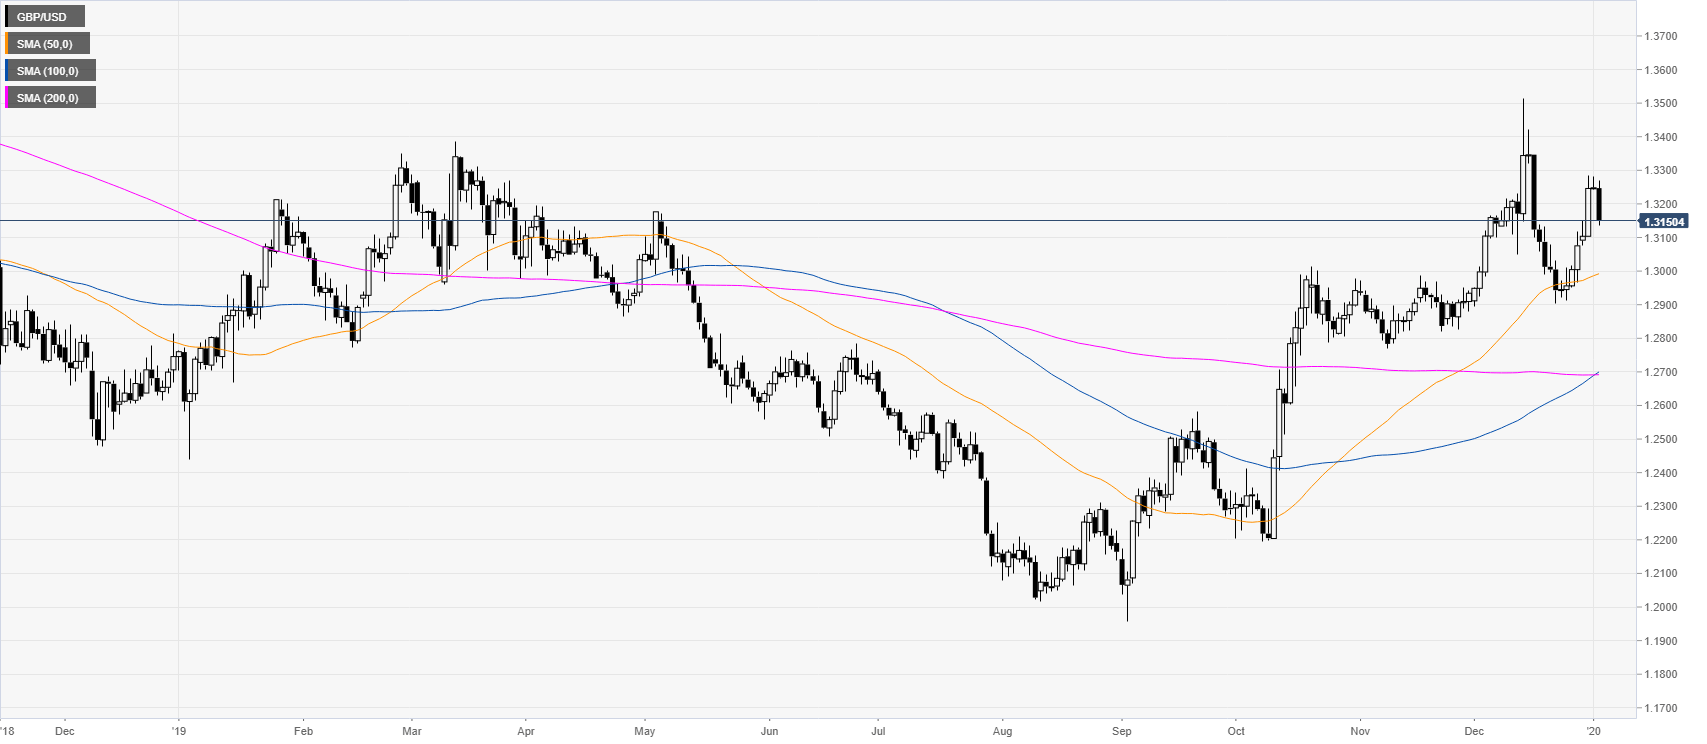
GBP/USD daily chart
The spot is trading above a flat 200-day SMA while above the 50 SMA. However, the rejection near the 2019 highs is likely indicative of further consolidation in the medium-term. Further down, the market would probably weaken on a daily close below the 1.2700/1.2600 price zone as this was a significant support/resistance in 2019.
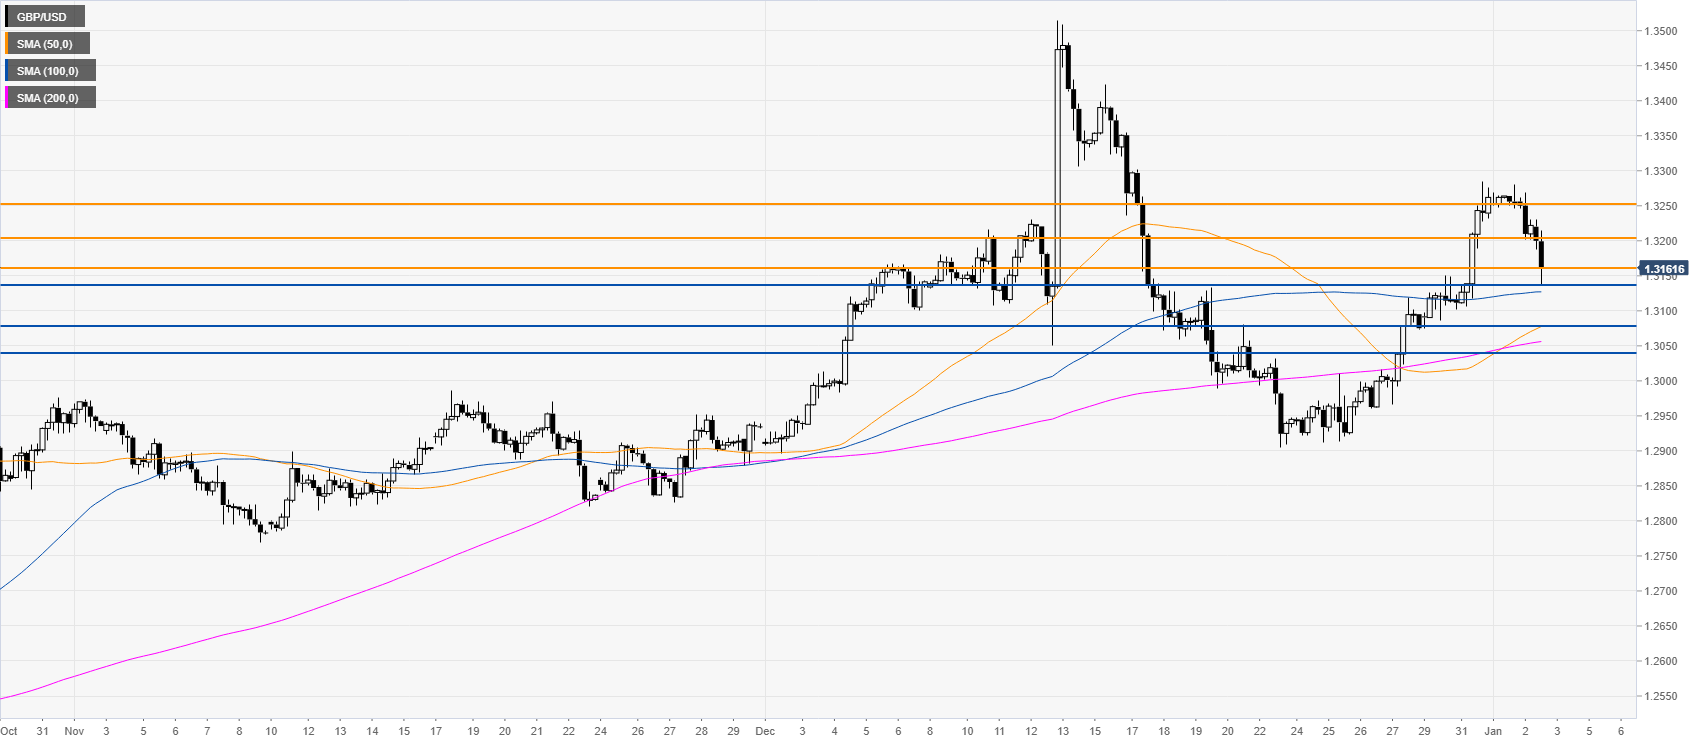
GBP/USD four-hour chart
The market is pulling back down now, approaching the 1.3134 support level. Bulls might have another test of the 1.3203 and 1.3250 resistances, however, if the bulls fail again, the market might be set for a deeper retracement with a potential extension down to the 1.3079 and 1.3038 levels, according to the Technical Confluences Indicator.
Additional key levels
