- GBP bulls defy broad USD comeback, as upbeat earnings lift the mood.
- The daily chart warrants caution amid oversold RSI.
- Focus shifts to US data, stimulus hopes and UK-US trade talks.
GBP/USD witnessed good two-way business so far this Tuesday, initially correcting to 1.2840 region before heading back towards the multi-week tops of 1.2904. Upbeat earnings and prospects of a UK-US trade deal underpin the sentiment around the cable.
At the moment, the price has formed a doji candle on the daily sticks, suggesting buyers’ exhaustion. However, there still remains some additional scope for the GBP bulls, as a test of the rising channel resistance at 1.2945 looks likely in the day ahead.
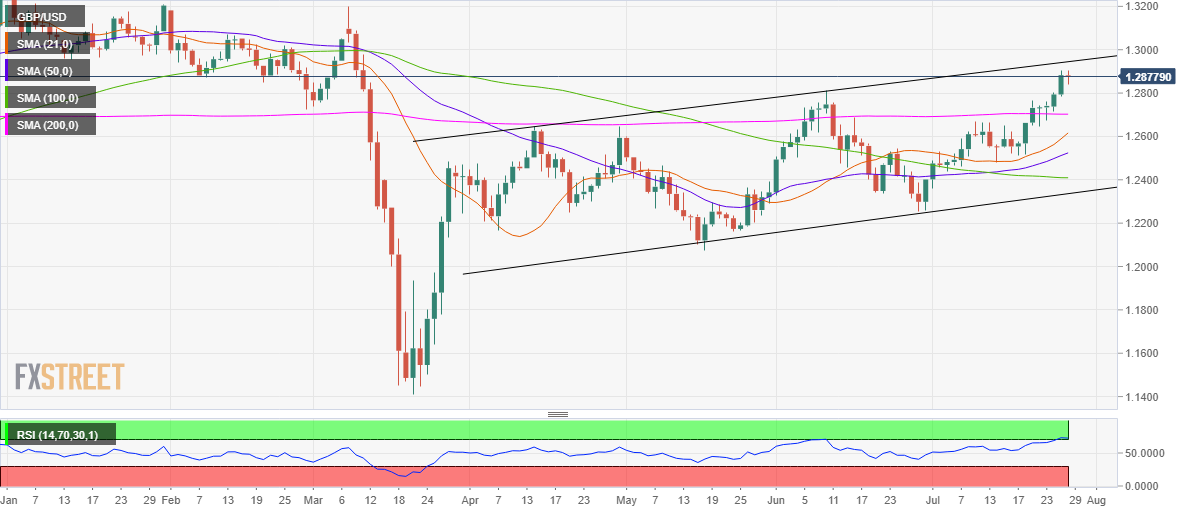
The case for the further upside is backed by the Relative Strength Index (RSI) at 72.00, having just entered the oversold territory.
The rising trendline resistance is likely to be a tough nut to crack for the bulls. Hence, any retracement could find immediate support at Monday’s low of 1.2782, below which the horizontal 200-daily Simple Moving Average (DMA) at 1.2702 could be put at risk.
From a short-term perspective, the spot has dived out of the falling channel on the hourly chart, calling for a test of the target pattern around 0.7235 levels in the coming days.
Further south, the bullish 21-DMA at 1.2616 will be the last resort for the buyers. The near-term bias could turn bearish on the break below the latter.
GBP/USD daily chart
GBP/USD additional levels
