- GBP/USD steps back from the previous day’s recovery.
- 200-bar SMA, 61.8% Fibonacci retracement add to the resistance.
- March 20 top could lure bears below the channel’s support.
GBP/USD drops 0.10% to 0.1.2320 as the Asian markets gain momentum amid the early Wednesday.
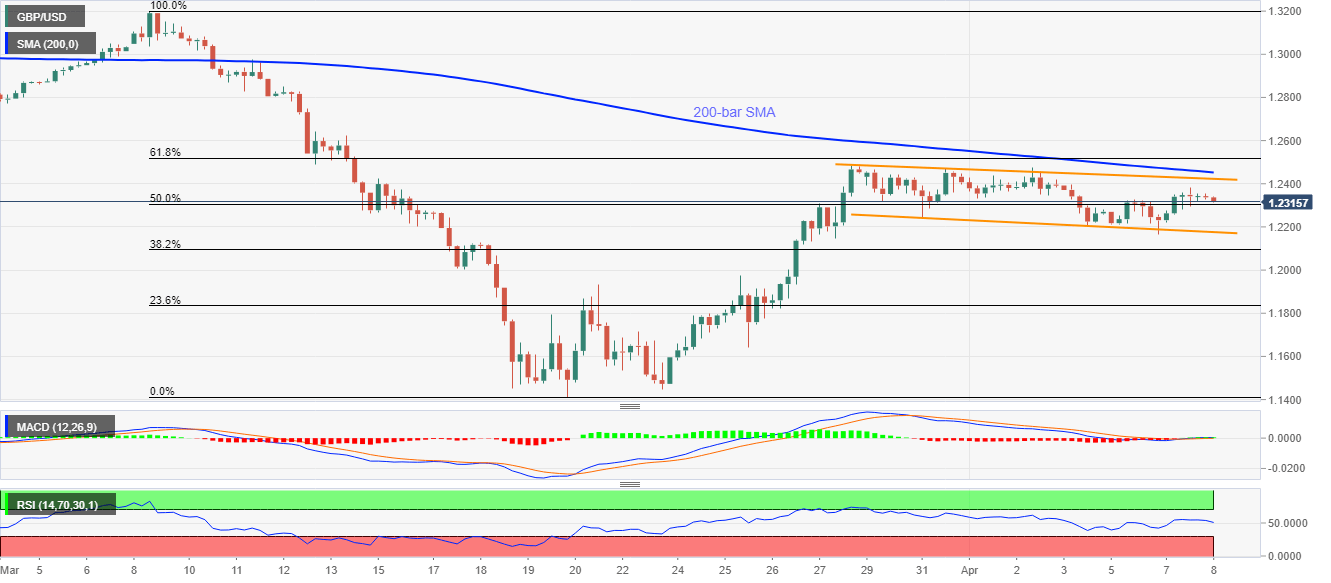
The pair remains inside an eight-day-old falling trend channel while staying below 200-bar SMA and 61.8% Fibonacci retracement of March-month declines.
While the lower line of the mentioned channel, near 1.2175, offers immediate strong support to the pair, 1.2000 and March 20 high around 1.1935 will appear on the sellers’ radars afterward.
Alternatively, the pair’s ability to cross the channel’s resistance line, currently close to 1.2425, needs to cross 200-bar SMA level of 1.2455, followed by 61.8% Fibonacci retracement figures around 1.2520, to convince the buyers.
GBP/USD four-hour chart
Trend: Sideways
