- GBP/USD halts the previous day’s recovery.
- A six-week-old rising trend line, 200-day SMA limit immediate declines.
- The key Fibonacci retracement levels to question the pair’s recovery.
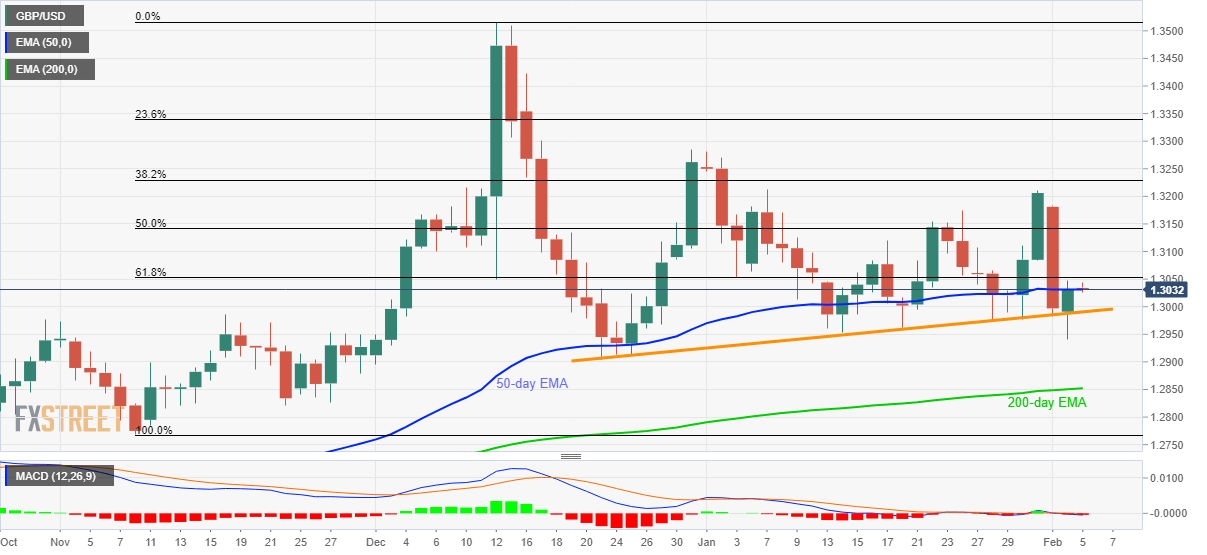
GBP/USD fails to extend the previous day’s recovery while taking rounds to 1.3030 during Wednesday’s Asian session. The cable clings to 50-day EMA while also remaining below 61.8% Fibonacci retracement level of the pair’s November-December 2019 advances.
Even so, an upward sloping trend line since December 23, 2019, at 1.2990 now, could restrict the pair’s near-term downside, if not then the quote’s drop to 200-day SMA level of 1.2850 can’t be ruled out.
During the pair’s further weakness below 1.2850, November 22, 2019 low near 1.2820 and the November month’s bottom close to 1.2770 can please the bears.
On the contrary, 61.8% and 50% Fibonacci retracement levels, around 1.3055 and 1.3140 respectively, will guard the pair’s short-term recovery.
In a case where GBP/USD prices manage to cross 1.3140 on a daily closing basis, 1.3210 and the yearly top near 1.3280 will be in focus.
GBP/USD daily chart
Trend: Sideways
