- GBP/USD turned positive for the third consecutive session on Monday.
- The strong intraday move up stalled near the 50% Fibo. level resistance.
- Mixed technical indicators warrant caution for aggressive bullish traders.
The GBP/USD pair attracted some dip-buying near the 1.3755 region and turned positive for the third consecutive session on Monday. The momentum lifted the pair back above 200-hour SMA, to four-day tops during the first half of the European session.
Bulls, however, took a brief pause near the 1.3840 region, a resistance marked by the 50% Fibonacci level of the 1.4002-1.3671 recent decline. The underlying bullish tone around the US dollar seemed to be the only factor capping gains for the GBP/USD pair.
Moreover, RSI (14) on the 1-hourly chart has moved on the verge of breaking into the overbought territory. This further held traders from placing aggressive bullish bets amid absent relevant market-moving economic releases, either from the UK or the US.
Meanwhile, technical indicators on the 4-hourly chart have been gaining positive traction. That said, oscillators on the daily chart are yet to confirm a bullish bias and further warrant some caution before positioning for any further appreciating move.
Hence, it will be prudent to wait for some strong follow-through buying before confirming that the recent slide from the key 1.4000 psychological mark has run its course. This will set the stage for an extension of the ongoing recovery from multi-week lows.
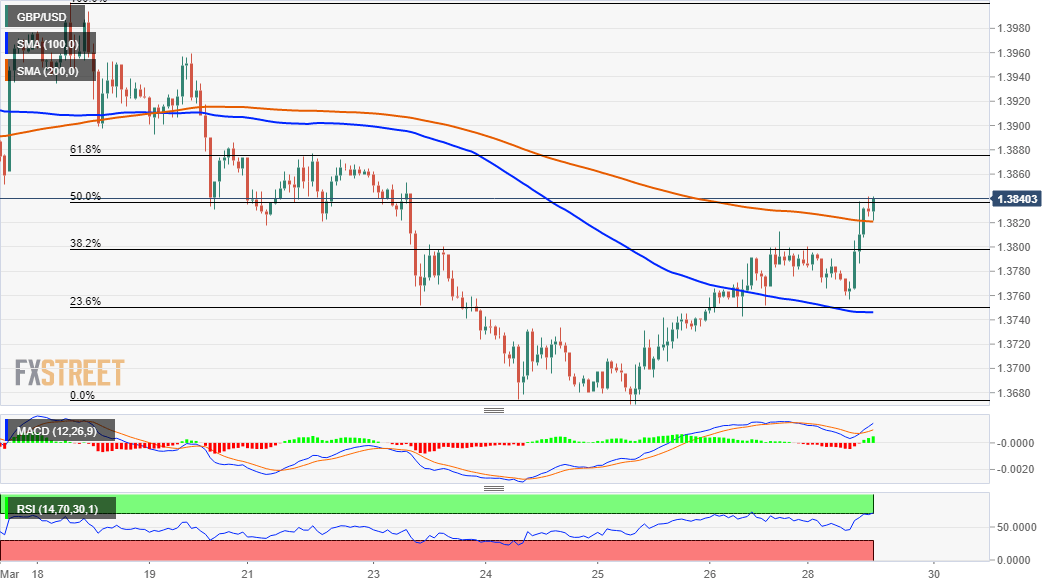
The GBP/USD pair was last seen trading around the 1.3835-40 area and the next relevant hurdle is pegged near the 1.3875 region (61.8% Fibo.). The pair might then surpass the 1.3900 mark and test a descending trend-line hurdle, around the 1.3925-30 region.
On the flip side, the 1.3800 mark (coinciding with the 38.2% Fibo. level) now seems to protect the immediate downside. Sustained weakness below might turn the GBP/USD vulnerable to accelerate the slide back towards the intraday swing lows, around the 1.3755 zone.
The latter comes just ahead of a confluence region, comprising of 100-hour SMA and the 23.6% Fibo. level. Failure to defend the mentioned support levels might prompt some aggressive selling and drag the GBP/USD pair further towards the 1.3700 round-figure mark.
This is followed by multi-month lows, around the 1.3670 zone touched last week, which if broken decisively should pave the way for a further decline. The GBP/USD pair might then aim to challenge 100-day SMA support, currently near the 1.3625 region.
GBP/USD 1-hourly chart
Technical levels to watch
