- GBP/USD eases from 4.5-month high flashed the previous day.
- Overbought RSI conditions, nearby resistance line favor sellers.
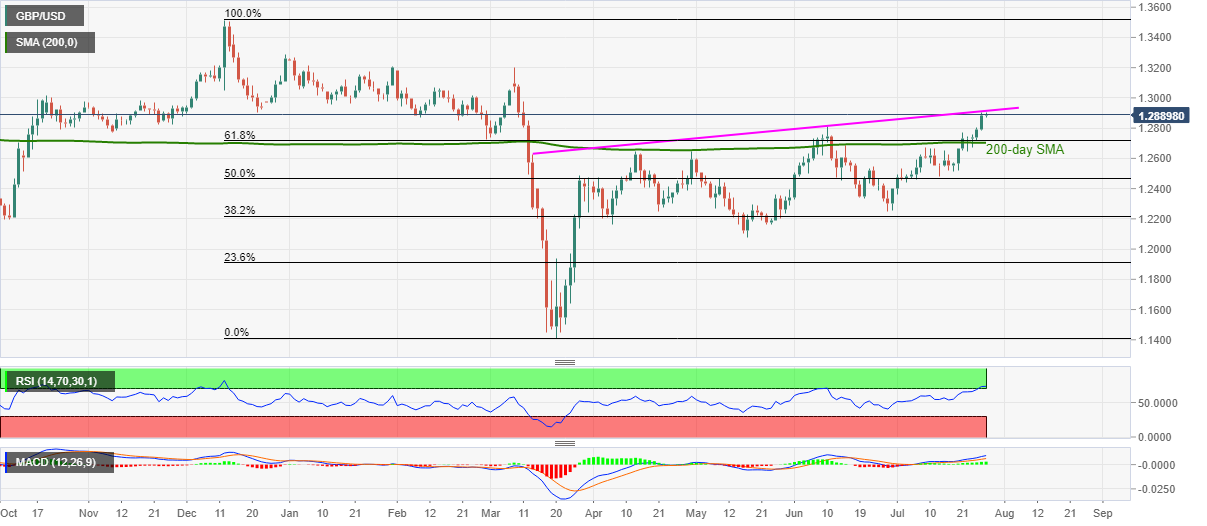
- A confluence of 200-day SMA, 61.8% Fibonacci retracement is the key support.
GBP/USD recedes to 1.2880 during the initial hour of Tokyo open on Tuesday. The Cable refreshed the highest levels since March 11 on Monday. Though, overbought RSI conditions and an upward sloping trend line from March 13 seem to back the latest range between 1.2867 and 1.2902.
During the pair’s further weakness, which is more likely, 61.8% Fibonacci retracement of December 2019 to March 2020 fall and 200-day SMA, around 1.2705-15, will offer strong support. It’s worth mentioning that June month’s top near 1.2815 can act as an immediate rest-point for the pair.
Should the bears refrain from respecting 1.2700 support, 50% Fibonacci retracement level of 1.2466 and the monthly bottom around 1.2360 can entertain the bears while targeting June 29 bottom close to 1.2250.
Meanwhile, an upside clearance of 1.2915 resistance line will be a clear signal to attack 1.3000 threshold with February 13 high of 1.3069 and March month’s peak surrounding 1.3200 be the next on the bulls’ radar.
GBP/USD daily chart
Trend: Pullback expected
