- GBP/USD bounces off seven-week low to regain 1.2800.
- Oversold RSI conditions suggest further pullback below the key Fibonacci retracement level.
- Early-July top, a descending trend line from September 04 offer near-term key support.
GBP/USD picks up bids near 1.2810 during the early Asian trading on Monday. In doing so, the Cable trims the losses below the 61.8% Fibonacci retracement of July 14 to September 01 upside amid oversold RSI conditions.
While the pair’s current pullback may take clues from RSI to attack the key Fibonacci retracement level near 1.2865, July 27 top surrounding 1.2900 can question the buyers afterward.
Should the quote manages to cross 1.2900, 50% of Fibonacci retracement and 200-bar SMA, respectively around 1.2980 and 1.3130, can probe the bulls.
Meanwhile, 1.2760 and July 09 high near 1.2670 could restrict the pair’s further downside ahead of the one-week-old falling trend line around 1.2640.
If at all the bears dominate past-1.2640, the mid-July bottom of 1.2480 will gain market attention.
GBP/USD four-hour chart
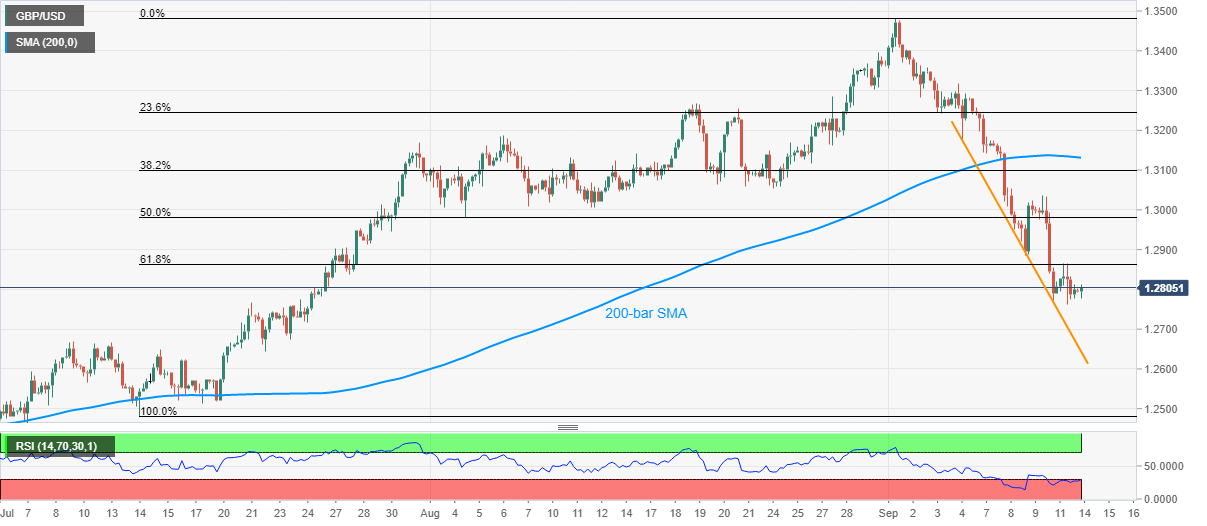
Trend: Bearish
