- GBP/USD stalled its recent strong rally near a resistance marked by the 61.8% Fibo. level.
- The technical set-up supports prospects for the emergence of dip-buying at lower levels.
The GBP/USD pair refreshed daily lows, around mid-1.3900s heading into the North American session and has now eroded a part of the previous day’s strong gains.
A turnaround in the global risk sentiment, along with a modest uptick in the US Treasury bond yields allowed the US dollar to stage a modest bounce from six-week lows. This, in turn, was seen as a key factor exerting some downward pressure on the GBP/USD pair.
From a technical perspective, overbought RSI (14) on hourly charts seemed to be the only factor that failed to assist bulls to find acceptance above the 1.4000 mark. The GBP/USD pair, for now, seems to have snapped six consecutive days of the winning streak.
That said, technical indicators on the daily chart have just started gaining positive traction and support prospects for additional gains. Hence, any subsequent pullback might still be seen as an opportunity for bullish traders and remain limited.
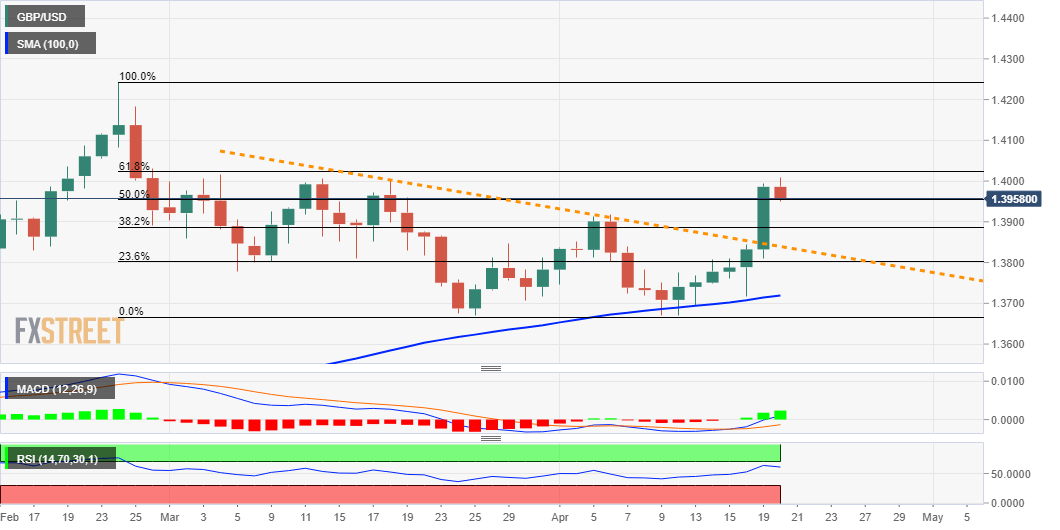
Meanwhile, the recent strong rally from the 100-day SMA support stalled near a resistance marked by the 61.8% Fibonacci level of the 1.4243-1.3669 downfall. This should now act as a key pivotal point and help determine the next leg of a directional move.
A sustained move beyond will be seen as a fresh trigger for bullish traders and pave the way for a move towards reclaiming the 1.4100 round-figure mark. The 1.4055-60 horizontal zone might offer some intermediate resistance on the way up.
On the flip side, the next relevant support to the downside is pegged near the 1.3900 mark. This is followed by a descending trend-line resistance breakpoint, around the 1.3850 region, which should now act as a strong near-term base for the GBP/USD pair.
GBP/USD daily chart
Technical levels to watch
