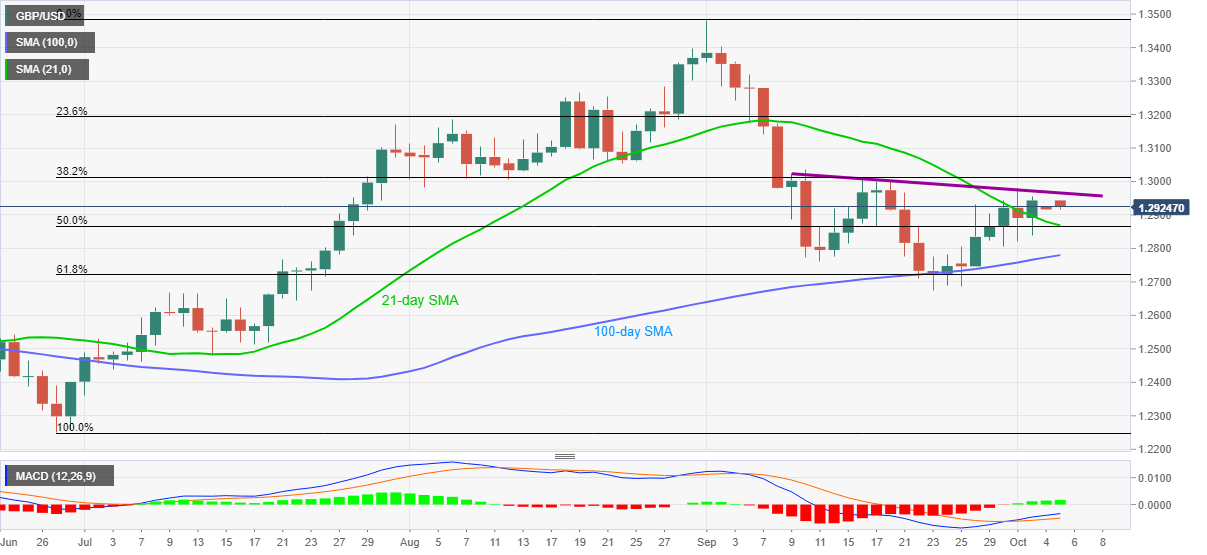
- GBP/USD defies Friday’s recovery moves while declining from 1.2943.
- A confluence of 21-day SMA, 50% Fibonacci retracement lures short-term sellers.
- Bulls seek a daily closing beyond 38.2% Fibonacci retracement for fresh entries.
GBP/USD drops to 1.2922 during the early Monday morning in Asia. In doing so, the Cable keeps the late Friday’s range above 1.2900 while staying below the previous day’s peak surrounding 1.2955.
With this, the pair marks another day below a descending trend line stretched from September 09, at 1.2965 now, which in turn suggests further weakness towards testing the 21-day SMA and 50% Fibonacci retracement of June-September upside, close to 1.2870.
It should, however, be noted that the bullish MACD indicates challenges to the quote’s downside past-1.2870, which if ignored may take rest near the 100-day SMA level of 1.2780 before testing 1.2720 support comprising 61.8% Fibonacci retracement.
Meanwhile, a daily closing beyond the 1.2965 resistance line won’t be enough to recall the buyers as multiple upside barriers near 38.2% of Fibonacci retracement, close to 1.3015, restrict the GBP/USD bulls afterward.
Also acting as the key resistance is August 24 low near 1.3055 that holds the key to a north-run targeting the 1.3200 threshold.
GBP/USD daily chart
Trend: Pullback expected
