- Lower-than-expected inflation figures raised hopes that the Fed would slow the pace of hikes.
- The US central bank is anticipated to raise interest rates by 50 basis points.
- Markets are awaiting UK inflation data.
Today’s GBP/USD price analysis is bullish. After taking a significant hit overnight, the US dollar found it difficult to recover against the pound on Wednesday. This was due to lower-than-expected inflation figures, which raised hopes that the Federal Reserve would announce a mild rate hike later in the day.
-Are you looking for automated trading? Check our detailed guide-
The US central bank is largely anticipated to raise interest rates by 50 basis points as it wraps up its two-day meeting on Wednesday after delivering four successive 75 basis point hikes.
According to Carol Kong, a currency strategist at the Commonwealth Bank of Australia, the slowdown in CPI inflation strengthens the case for the FOMC to reduce the increase in the Funds rate to 50 basis points (CBA).
According to the Labor Department’s report released on Tuesday, consumer prices in the United States increased less than anticipated for a second consecutive month in November, with underlying prices rising at their slowest rate in 15 months.
Fed funds futures have already factored in a lower terminal rate, whereby the Fed stops raising rates by March at a level just below 5%. Traders are now predicting rises of 25 basis points at each of the Fed’s first two meetings in 2023 and no more; however, there is a potential that the final increase may occur in May rather than March.
GBP/USD key events today
Investors are awaiting UK inflation figures which will give clues on the Bank of England’s future monetary policy. After the US inflation data, investors will pay attention to Powell’s press conference for clues on the future of monetary policy.
GBP/USD technical price analysis: Bulls finally break above the 1.2300 key resistance
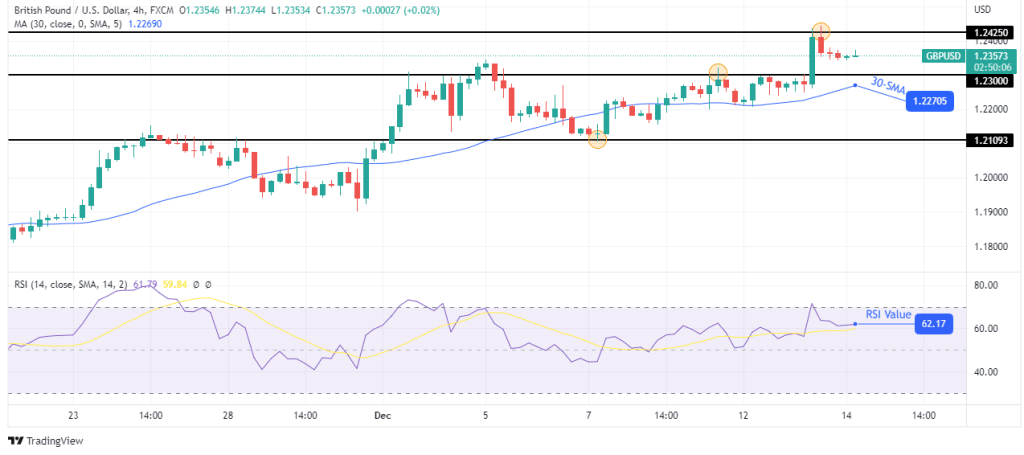
The 4-hour chart shows a strong bullish candle that broke through the 1.2300 key resistance level. The price is currently trading above the 30-SMA, a sign that bulls are stronger. The bulls also have momentum as the RSI trades above 50.\
-If you are interested in forex day trading then have a read of our guide to getting started-
The bullish move paused after reaching the 1.2425 level, where bears returned for a pullback. The pullback has been weak, supporting the continuation of the bullish trend. Therefore, bulls will be looking to break above the 1.2425 resistance to make a higher high.
Looking to trade forex now? Invest at eToro!
67% of retail investor accounts lose money when trading CFDs with this provider. You should consider whether you can afford to take the high risk of losing your money.
