- GBP/USD stands on a slippery ground after flashing a bearish candlestick formation on Friday.
- An upward sloping trend line from April lures the short-term bears.
- Bulls will wait for a clear break of 1.3200 to defy the claims of a pullback.
GBP/USD declines to 1.3065, down 0.18% on a day, during the initial hour of Tokyo open on Monday. The quote’s latest moves follow Friday’s bearish candlestick formation on the daily chart. The same gains support from oversold RSI conditions to favor the sellers.
As a result, the Cable is likely to extend its recent weakness towards the resistance-turned-support line from mid-April, currently around 1.2975. However, 1.3000 round-figures might offer immediate support.
Should the pair drops below 1.2975, its further downside to June month’s high near 1.2815 can’t be ruled out.
On the flip side, buyers may attack 1.3100 to challenge March month’s high near 1.3200. However, any strong upside following that will target the yearly top near 1.3260/65.
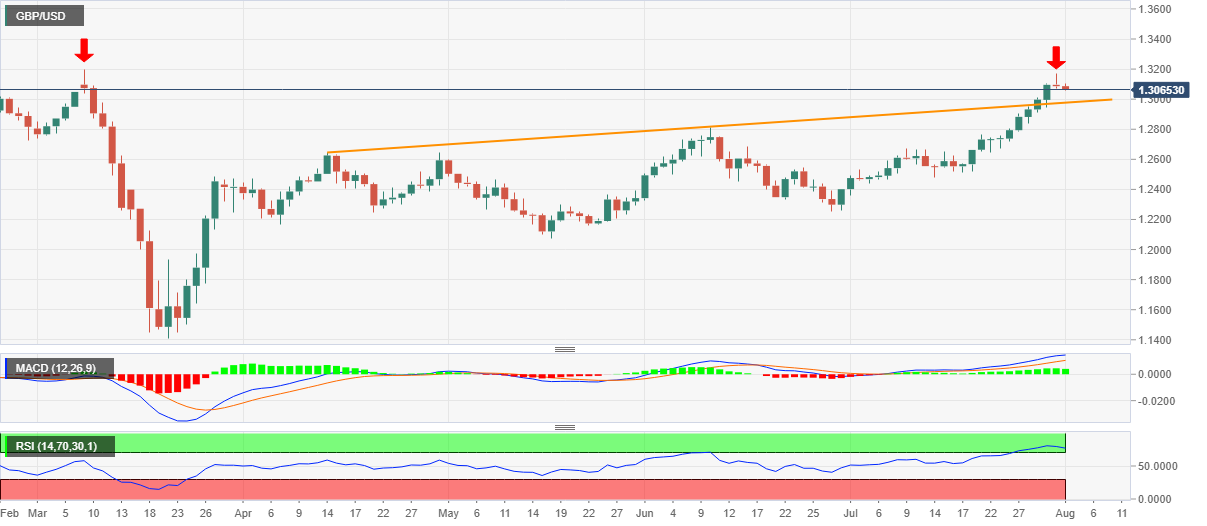
GBP/USD daily chart
Trend: Pullback expected
