- GBP/USD prints mild losses while extending pullback from one-week-old resistance line.
- 200-bar SMA adds to the downside filters, 1.4000 offers extra resistance.
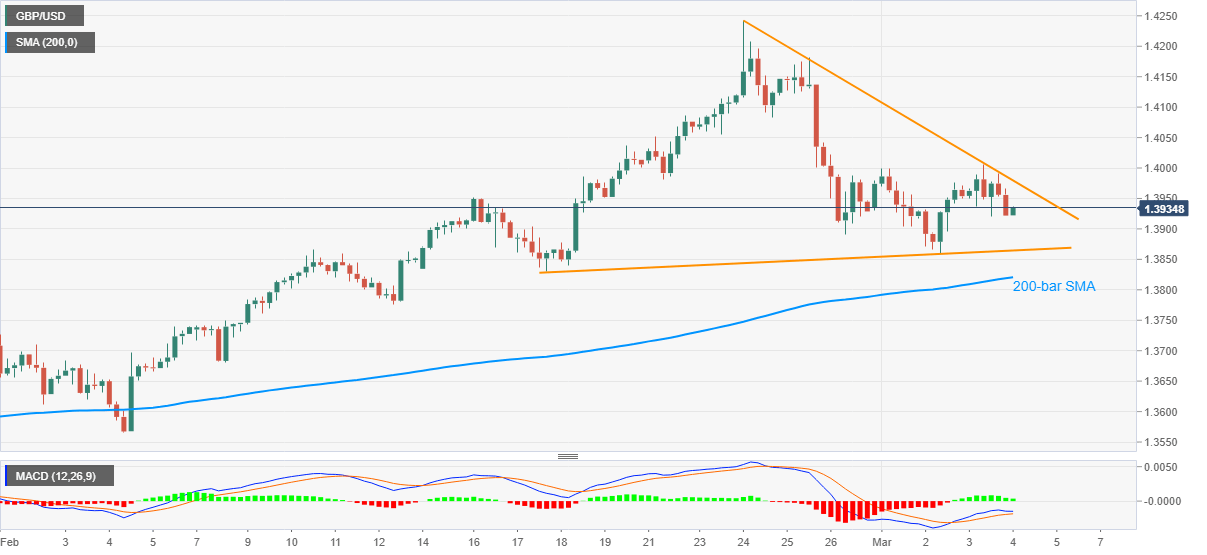
GBP/USD teases intraday low of 1.3921, currently down 0.14% around 1.3932, during Thursday’s Asian session. In doing so, the cable stretches the pullback from a one-week-old resistance line as MACD recedes bullish bias.
The quote currently declines towards the 1.3900 threshold but any further weakness needs to break an ascending support line from February 17, at 1.3865 now, to again challenge the 200-bar SMA level of 1.3820.
In a case where the GBP/USD prices remain depressed below 1.3820, the previous monthly low near 1.3565 should return to the charts.
Meanwhile, an upside break of the immediate resistance line, currently around 1.3980, needs to get validation from the 1.4000 round-figures before recalling the GBP/USD buyers.
The resulted upside past-1.4000 will eye for the multi-month peak marked in February around 1.4245.
GBP/USD four-hour chart
Trend: Further weakness expected
