- A combination of factors assisted GBP/USD to gains positive traction on Wednesday.
- The intraday positive momentum faltered just ahead of the 1.3800 round-figure mark.
- Mixed oscillators on hourly/daily charts warrant some caution for aggressive traders.
Having defended the 1.3700 mark in the previous session, the GBP/USD pair managed to regain some positive traction on Wednesday and snapped two consecutive days of the losing streak.
The British pound got a modest lift following the release of better-than-expected UK GDP growth figures for the fourth quarter of 2020. Apart from this, a modest US dollar pullback from multi-month tops provided an additional boost to the GBP/USD pair.
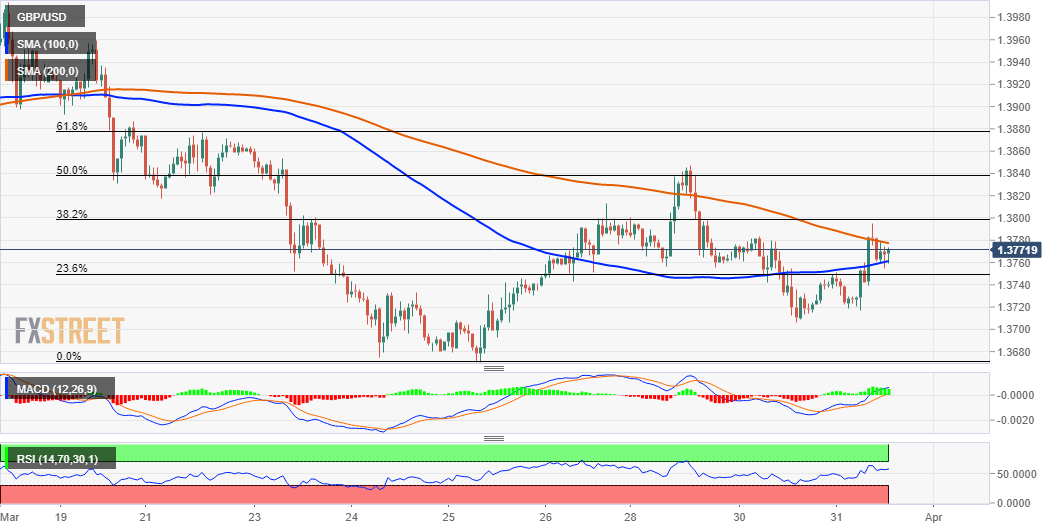
From a technical perspective, a sustained move back above 100-hour SMA was seen as a key trigger for intraday bullish traders. That said, the GBP/USD pair continued with its struggle to find acceptance above the 200-hour SMA and failed ahead of the 1.3800 mark.
The mentioned handle coincides with the 38.2% Fibonacci level of the 1.4002-1.3671 recent decline and should now act as a key pivotal point for short-term traders. In the meantime, the GBP/USD pair has now retreated back to 100-hour SMA, around the 1.3760-65 region.
Meanwhile, technical indicators on the 1-hour chart have been gaining positive traction and also recovered from the bearish zone on the 4-hour chart. However, oscillators on the daily chart are yet to confirm a bullish outlook and warrant caution for aggressive traders.
This makes it prudent to wait for a sustained strength beyond the 1.3800 mark before positioning for any further appreciating move. The GBP/USD pair might then resume its recent recovery move from multi-week lows and aim back to weekly tops, around mid-1.3800s.
On the flip side, the 1.3745-40 region now seems to protect the immediate downside, below which the GBP/USD pair could slide back towards the 1.3700 mark. Some follow-through selling should allow bearish traders to challenge multi-week lows, around the 1.3670 region.
GBP/USD 1-hour chart
Technical levels to watch
