- GBP/USD extends recovery moves from 50% Fibonacci retracement.
- 200-day EMA becomes the key resistance, 21-day EMA restricts immediate downside.
- Bulls likely to cheer an upside break of important EMA amid normal RSI conditions.
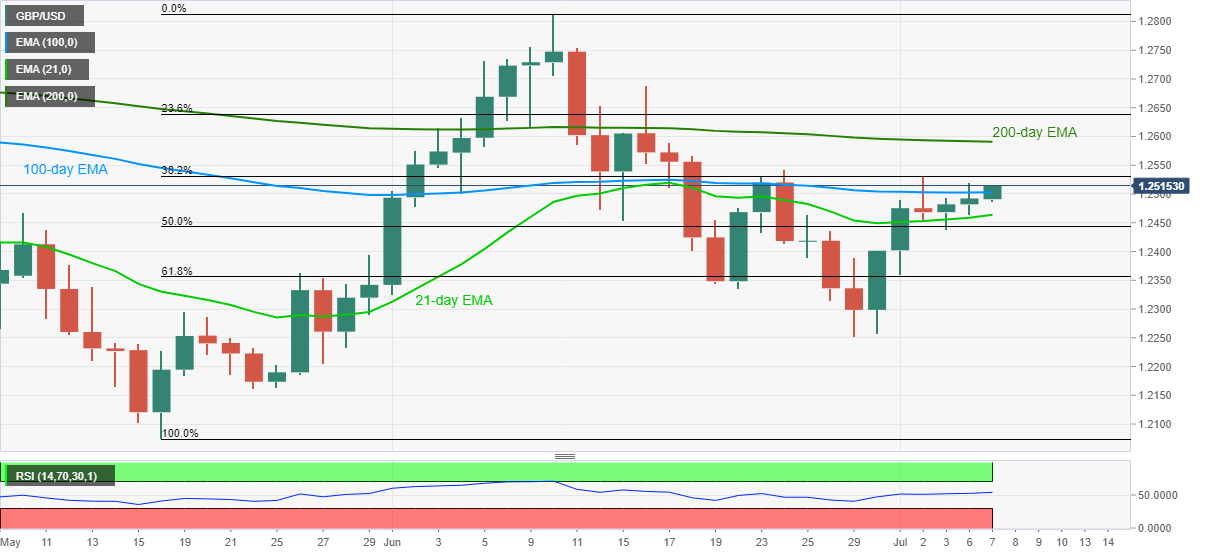
GBP/USD takes the bids near 1.2516, up 0.19% on a day, during the initial hour of Tokyo open on Tuesday. The Cable recently surged after a successful break beyond 100-day EMA. In doing so, the quote stretches its pullback moves from 50% Fibonacci retracement level of May-June upside.
Given the absence of abnormal RSI, backed by the pair’s trading beyond the key supports, buyers are likely to aim for a 200-day EMA level of 1.2591 during the further rise. Though, 1.2550 can act as a buffer during the surge.
If the upside momentum stays intact beyond 1.2600 round-figure, the mid-June top near 1.2690 and 1.2700 threshold could entertain the bulls ahead of pushing them towards the previous month’s top surrounding 1.2810/15.
Alternatively, sellers will look for entries below a 21-day EMA level of 1.2463 to attack 50% Fibonacci retracement close to 1.2440.
In a case where the pair remains depressed below 1.2440, 61.8% Fibonacci retracement level of 1.2362 and June month bottom of 1.2251 can become the bears’ favorites.
GBP/USD daily chart
Trend: Bullish
