- GBP/USD keeps the previous day’s recovery moves to refresh intraday high.
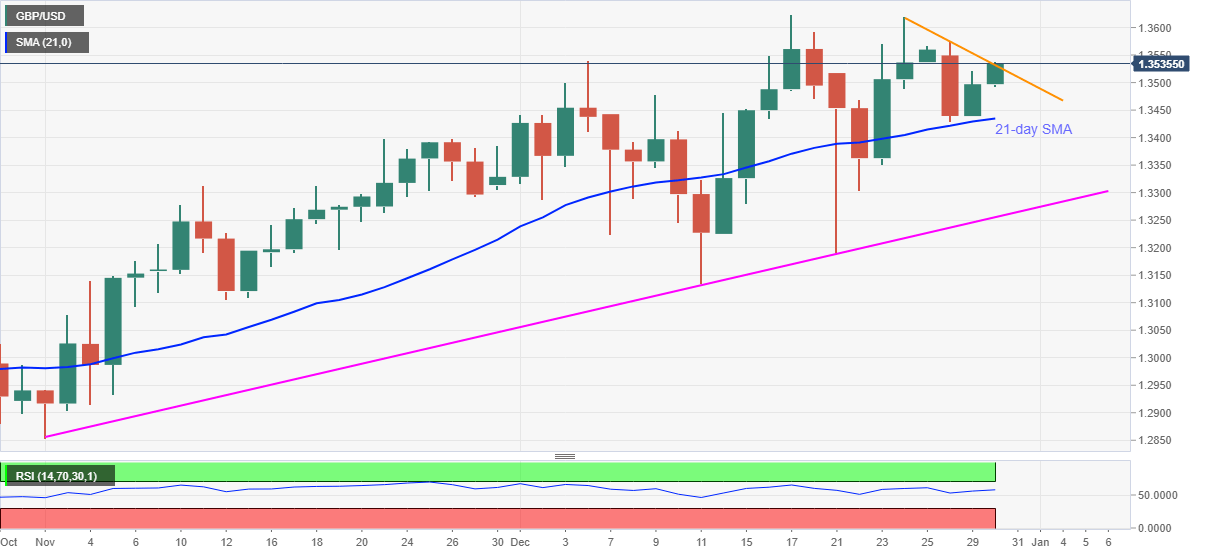
- A descending trend line from last Thursday guards nearby upside.
- An eight-week-old rising support line becomes the key.
GBP/USD picks the bids near 1.3535, up 0.27% intraday, during Wednesday’s Asian session. In doing so, the cable stretches the U-turn from 21-day SMA as buyers attack a falling trend line from December 24.
Considering upbeat RSI conditions, as well as successful trading above 21-day SMA and an upward sloping trend line from November 02, GBP/USD bulls are set to challenge the monthly peak surrounding 1.3620.
However, the stated resistance line near 1.3535 and the 1.3600 round-figure can offer intermediate halts during the rise.
Should sterling buyers keep the reins past-1.3620, March 2018 low around 1.3710 will be the key.
On the flip side, the 1.3500 threshold can offer immediate support ahead of the 21-day SMA, currently around 1.3430.
Though, GBP/USD bears are less likely to intervene unless witnessing a daily close below the multi-day-old support line, at 1.3255 now.
GBP/USD daily chart
Trend: Bullish
