- GBP/USD remains capped by the falling trendline resistance.
- Thursday’s recovery to gains traction only above $1.2991.
- Bullish hourly RSI still keeps the buyers hopeful.
GBP/USD is trying hard to extend the recovery from the dovish Bank of England (BOE) policy decision induced sell-off to 1.2865.
The cable tumbled over 100-pips to reach two-day lows after the BOE clearly suggested it may consider adopting negative rates framework for the first time in its history to battle the economic impact of the coronavirus and a potential no-deal Brexit.
Meanwhile, fears of a nationwide lockdown in the UK due to the intensifying spread of coronavirus also kept the buyers unnerved. However, broad-based US dollar weakness, amid uncertainty over the US economic prospects, and improving UK retail volumes saved the day for the GBP bulls.
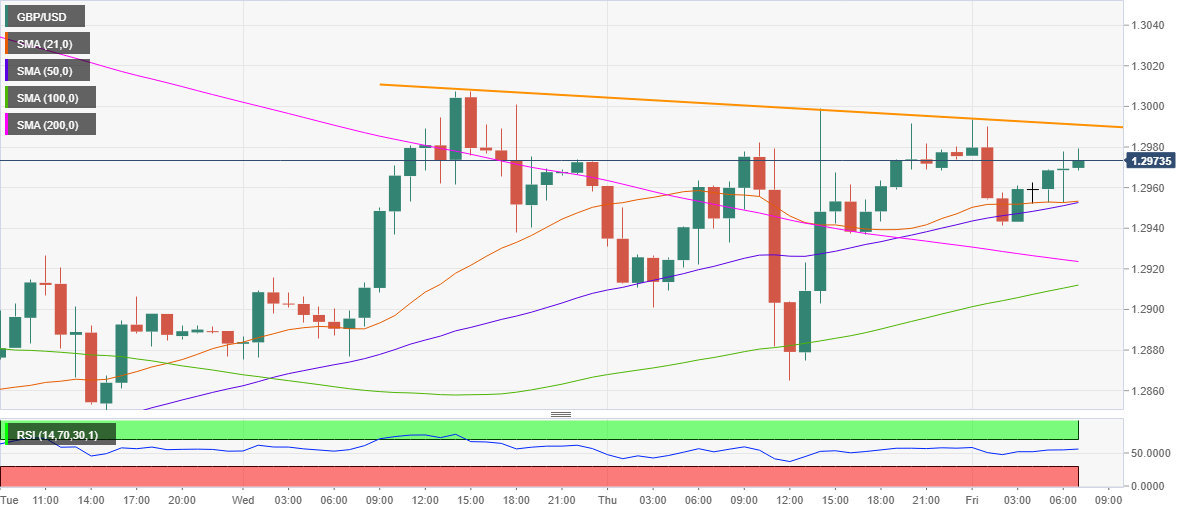
From a short-term technical view, the bulls are once again attempting to take out the powerful falling trendline resistance (orange line), now at 1.2991.
The hourly Relative Strength Index (RSI) holds above the midline at 55.41, indicative of more gains. A sustained move above the aforesaid hurdle will open doors towards the September 10 high at 1.3035.
On the flip side, the confluence of the 21 and 50-hourly Simple Moving Average (HMA) at 1.2953 will guard the immediate downside. A break below which the sellers could target the bearish 200-HMA support at 1.2923 en route the 1.2900 level.
GBP/USD: Hourly chart
GBP/USD: Additional levels
