- GBP/USD picks up bids following multiple bounces off mid-1.3700s.
- 100, 200-SMA joins monthly resistance line to challenge the bulls.
- Receding bullish MACD, bearish chart pattern on one-hour formation keep sellers hopeful.
GBP/USD refreshes intraday high to 1.3775, up 0.06% on a day, during Tuesday’s Asian session. In doing so, the cable repeats bounce off 1.3750-55 horizontal support.
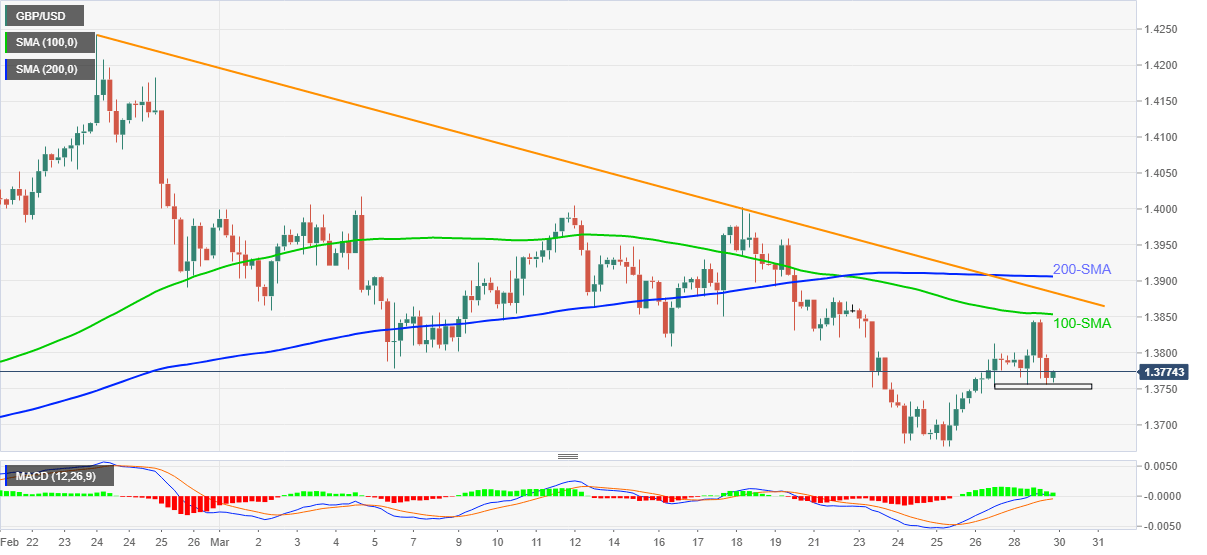
Considering the bullish MACD, the latest corrective pullback eyes the 1.3800 threshold. However, the quote’s further upside will be challenged by the 100-SMA level of 1.3853.
Even if the GBP/USD buyers manage to cross 1.3853, a downward sloping trend line from February 24 and 200-SMA, respectively around 1.3885 and 1.3906, will be tough challenges for the bulls.
Meanwhile, the receding strength of the bullish MACD can recall the GBP/USD sellers if the quote drops below 1.3750 as FXStreet’s Ross J Burland cites head-and-shoulders bearish chart formation on the hourly play.
Although the monthly low around 1.3670 could lure the GBP/USD bears following 1.3750, any further downside may not refrain from attacking February’s low near 1.3565.
GBP/USD four-hour chart
Trend: Bearish
